|

Band Protocol price prepares for a potential 50% move to $11

  • Band Protocol price seems to be bounded inside an inverse head and shoulders pattern.
  • There is only one crucial resistance level separating BAND from a massive breakout.

BAND has been trading inside a price range between $8 and $5 for the past three weeks and seems to be on the verge of a massive breakout. The digital asset faces a critical resistance level at $7.5.

Band Protocol price should benefit from the market’s bullishness 

Bitcoin price reached a new all-time high and several cryptocurrencies are trying to follow it. Band Protocol price is contained inside an inverse head and shoulders pattern on the 4-hour chart.

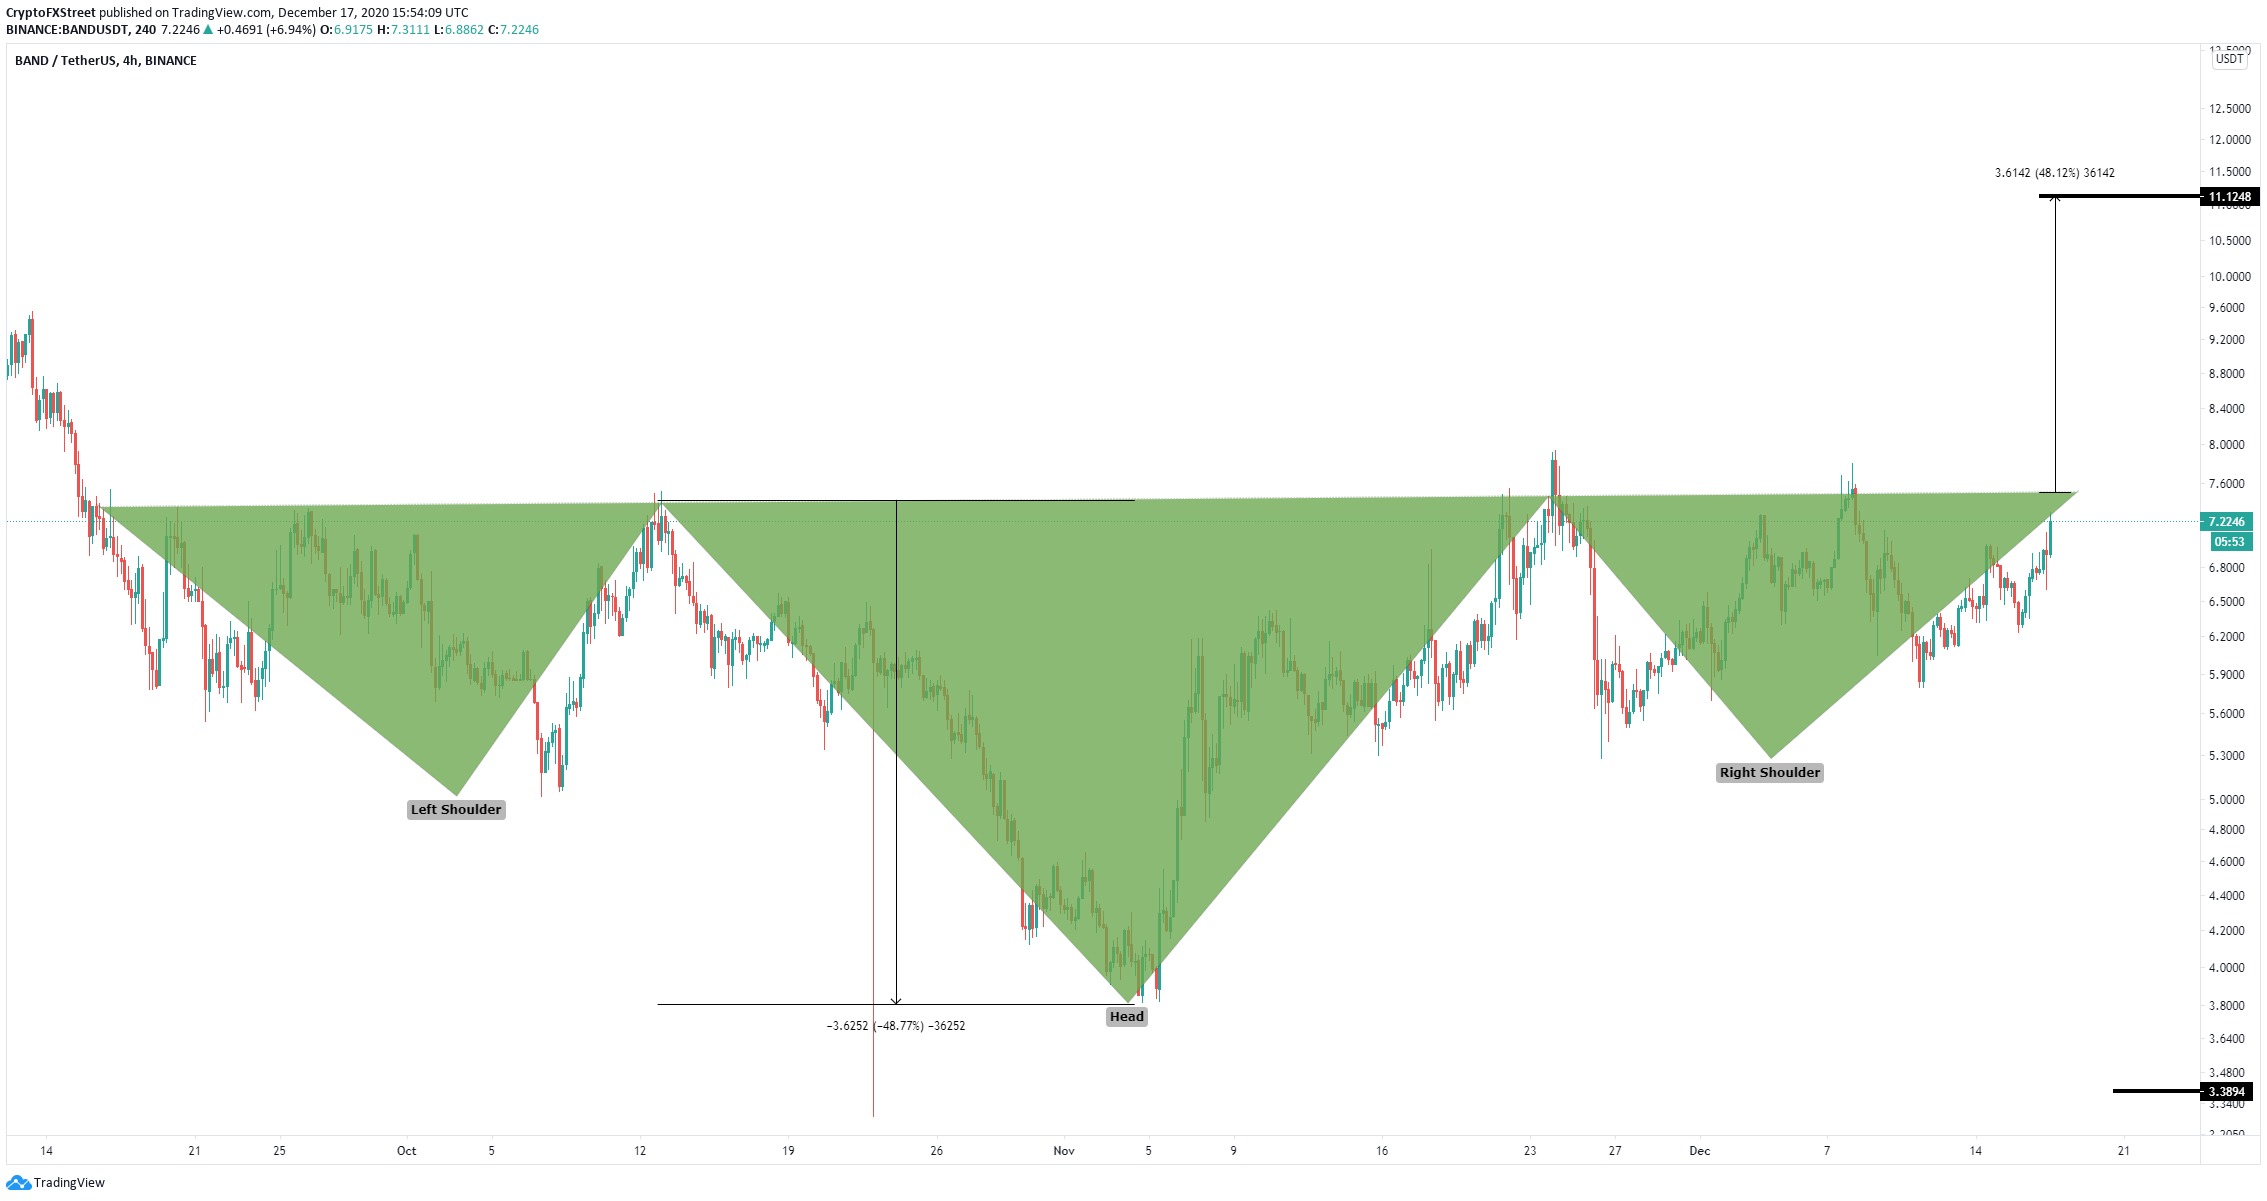
BAND/USD 4-hour chart

The neckline resistance level is established at $7.5. A breakout above this point can quickly push Band Protocol price above $8 towards a target of $11 in the long-term. 

BAND IOMAP chart

Furthermore, it seems that the In/Out of the Money Around Price (IOMAP) chart shows practically no resistance ahead of $7 which gives even more credence to the bullish outlook.

However, a rejection from the critical level at $7.5 would be a bearish sign which can potentially push Band Protocol price towards the next support level at $6.6. A breakdown below this point would drive the digital asset to a low of $5.8. 

Author

Lorenzo Stroe

Lorenzo Stroe

Independent Analyst

Lorenzo is an experienced Technical Analyst and Content Writer who has been working in the cryptocurrency industry since 2012. He also has a passion for trading.

More from Lorenzo Stroe
Share:

Editor's Picks

Crypto Today: Bitcoin at $60,000, Ethereum at $1,500, and XRP at $1 face a make-or-break test

Bitcoin (BTC), Ethereum (ETH), and Ripple (XRP) are trading in the red on Friday after three consecutive days of losses, testing their respective make-or-break support levels.

Bitcoin Weekly Forecast: BTC hits 20-month low, will the pain continue?

Bitcoin recovers slightly, trading at $66,000 on Friday after reaching a new yearly low of $58,115 earlier this week, its lowest level since October 2024. Institutional selling intensified as spot ETFs recorded $1.35 billion in net outflows through Thursday.

XRP clings to $1 as long liquidations deepen bearish trend

Ripple trades near the key psychological support level of $1 at the time of writing on Friday after losing more than 8% so far this week. CoinGlass liquidation data shows that over 97% XRP long positions were wiped out over the past 24 hours.

Pi Network Price Forecast: Minor recovery amid market crash fuels short-term hope

Pi Network price records a mild 3% recovery at press time on Friday, shaping a rebound from a broken descending trendline. The declining trend in trading volume has stabilized around $10 million this week, supporting the possibility of an extended recovery as selling pressure wanes.

Bitcoin: BTC hits 20-month low, will the pain continue?
Bitcoin (BTC) recovers slightly, trading at $66,000 on Friday after reaching a new yearly low of $58,115 earlier this week, its lowest level since October 2024. Institutional selling intensified as spot Exchange Traded Funds (ETFs) recorded $1.35 billion in net outflows through Thursday.