- Axie Infinity price bounces off the $102.62 to $114.53 demand zone, indicating an increased buying pressure.
- The consolidative downtrend will make the upcoming 20% advance challenging for the buyers.
- A breakdown of the demand zone’s lower limit at $102.62 will invalidate the bullish thesis.
Axie Infinity price shows strength after being on a continuous downswing since its all-time high on October 4. After bouncing off a crucial support area, AXS looks ready to make a comeback.
Axie Infinity price looks to break free
Axie Infinity price rose 108% from October 1, setting up a new all-time high at $154.90. However, this explosive ascent retraced soon after, pushing AXS down into a slow and consolidative downtrend that sliced through the 261.8% Fibonacci extension level at $119.59.
Although Axie Infinity price broke this barrier, it made a quick comeback that has sliced through it and shows a willingness to go higher. The hidden bullish divergence between the price and the Relative Strength Index (RSI) supports this bullish uptick. This technical formation occurs when the price sets up higher lows, but the RSI creates lower lows. The setup forecasts a bullish breakout, which is currently being witnessed.
Investors can expect Axie Infinity price to rally at least 20% to tag the 361.8% Fibonacci extension level at $143.03. This move is ideal and collects the buy-stop liquidity resting above the October 6 and October 8 swing highs.
In some cases, Axie Infinity price might make a run at the 432.6% Fibonacci extension level at $157.52 and set up a new all-time high.
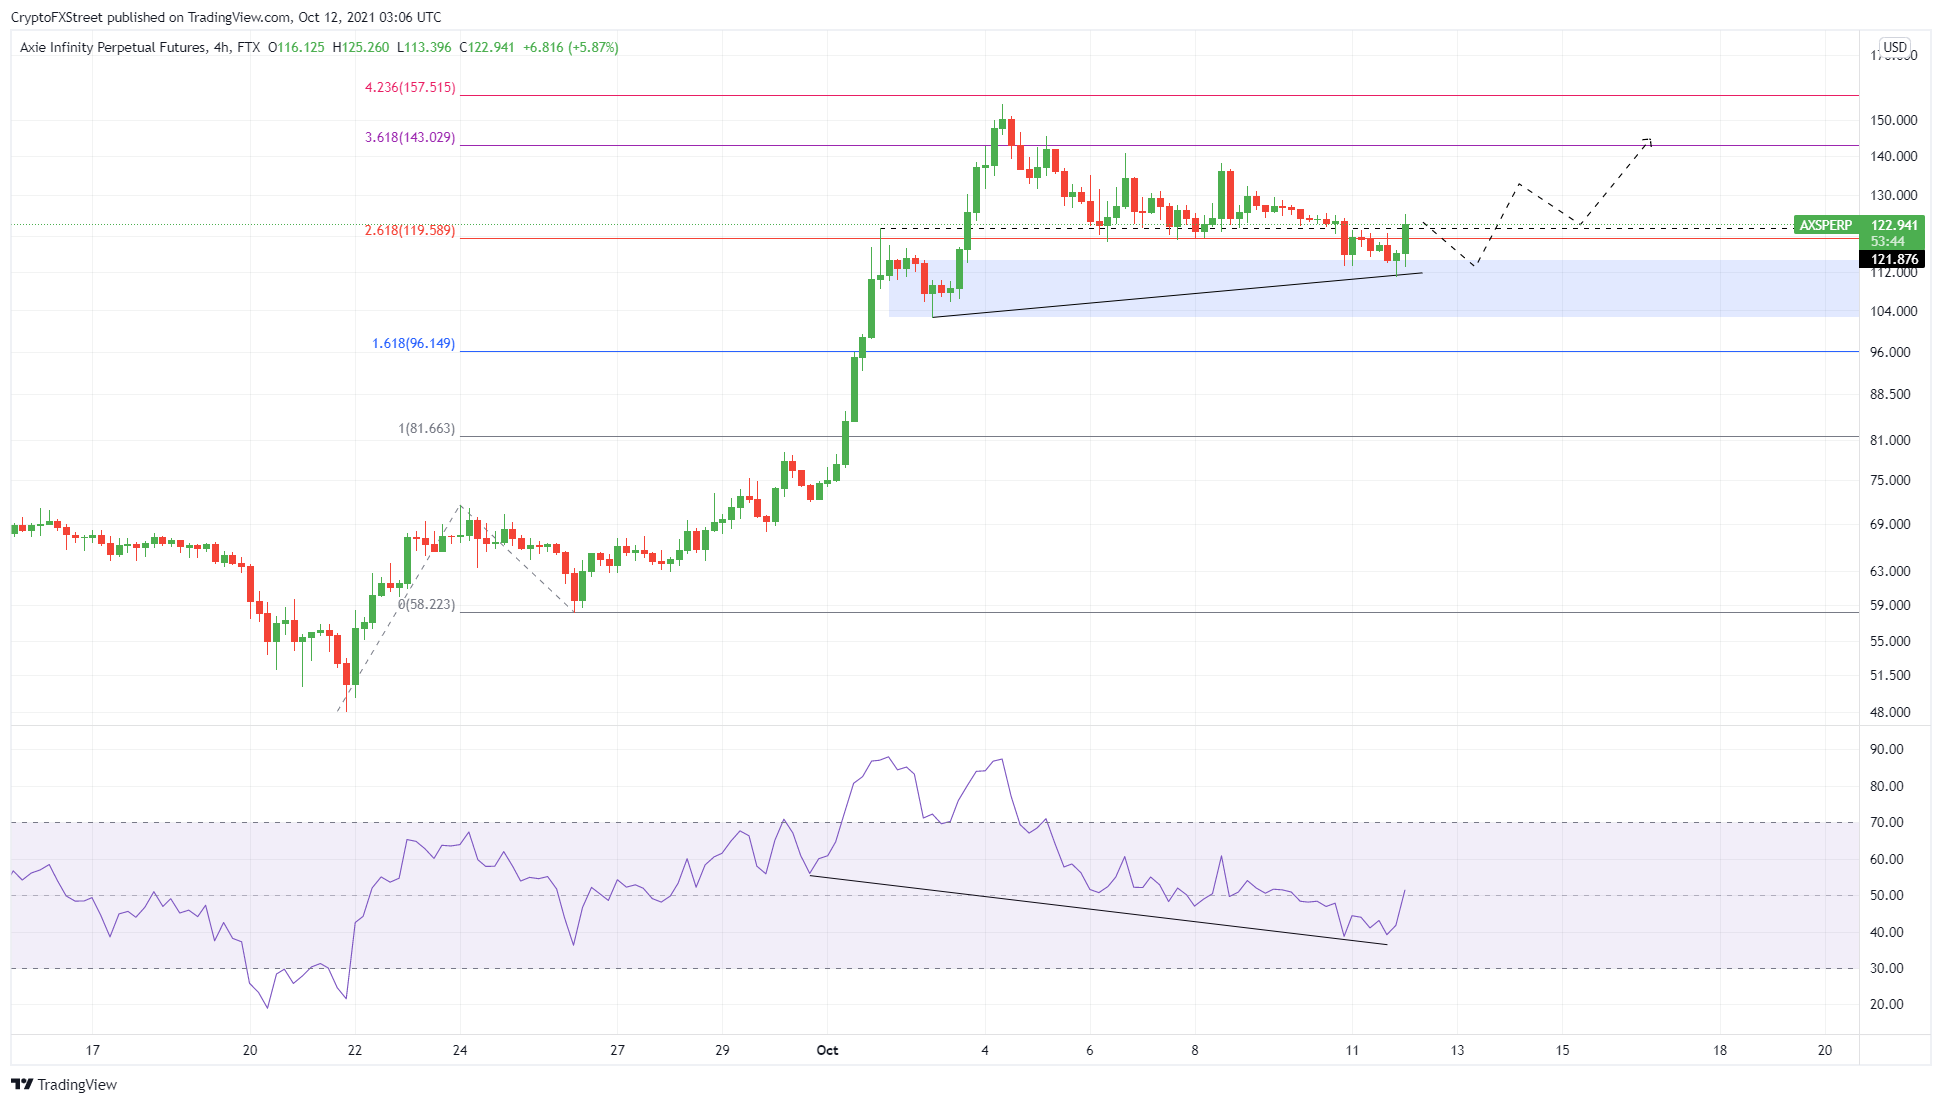
AXS/USDT 4-hour chart
While things are going well for Axie Infinity price, a reentry into the $102.62 to $114.53 demand zone indicates that the buyers lack strength. In this situation, a potential increase in selling pressure is likely to result in the creation of an equal low at $102.62. While AXS can make a comeback here, a decisive close below $102.62 will, however, invalidate the bullish thesis.
Such a move could result in a downswing to the 161.8% Fibonacci extension level at $96.15.
Information on these pages contains forward-looking statements that involve risks and uncertainties. Markets and instruments profiled on this page are for informational purposes only and should not in any way come across as a recommendation to buy or sell in these assets. You should do your own thorough research before making any investment decisions. FXStreet does not in any way guarantee that this information is free from mistakes, errors, or material misstatements. It also does not guarantee that this information is of a timely nature. Investing in Open Markets involves a great deal of risk, including the loss of all or a portion of your investment, as well as emotional distress. All risks, losses and costs associated with investing, including total loss of principal, are your responsibility. The views and opinions expressed in this article are those of the authors and do not necessarily reflect the official policy or position of FXStreet nor its advertisers. The author will not be held responsible for information that is found at the end of links posted on this page.
If not otherwise explicitly mentioned in the body of the article, at the time of writing, the author has no position in any stock mentioned in this article and no business relationship with any company mentioned. The author has not received compensation for writing this article, other than from FXStreet.
FXStreet and the author do not provide personalized recommendations. The author makes no representations as to the accuracy, completeness, or suitability of this information. FXStreet and the author will not be liable for any errors, omissions or any losses, injuries or damages arising from this information and its display or use. Errors and omissions excepted.
The author and FXStreet are not registered investment advisors and nothing in this article is intended to be investment advice.
Recommended Content
Editors’ Picks
Ripple's move above this key level could trigger nearly 50% rally for XRP
Ripple has overcome a critical resistance level and flipped into a support floor on the weekly time frame. This development happened while XRP tightly consolidated for roughly 250 days. Investors can expect XRP to kickstart a massive rally.
Optimism price outlook with nearly $90 million worth of OP tokens flooding markets on Friday
Optimism volatility has shrunk in the ours leading to the network’s cliff unlock. It joins the likes of dYdX and Sui, which have similar events on their calendars. As token unlocks are often considered bearish catalysts, investors should brace for a reaction after the event.
Top 3 Price Prediction Bitcoin, Ethereum, Ripple: Retail watches from the sidelines with a bias for shorts
Bitcoin could clear $73,777 peak as BTC bulls resurface. Ethereum might fall 10% before next leg up as ETH RSI teases with sell signal. XRP could lose $0.6000 threshold as Ripple bulls fail to show up.
Jito price could hit $6 as JTO coils up inside this bullish pattern
Jito price action shows a potential cup and handle formation. Based on theoretical measurement rules, a successful breakout could yield a 56% rally to $6.0. A breakdown of the $3.86 support level would create a lower low for JTO and invalidate the bullish thesis.
Bitcoin: BTC may have recovered, but is it out of the woods?
Bitcoin’s (BTC) upward momentum has shown a significant decline for the past two weeks or so. This development led to a bearish signal on the weekly and an uncertain outlook on the monthly.