Arbitrum price plots quick but efficient recovery rally to $1.32
- Arbitrum price consolidates in a falling wedge pattern, suggesting a potential for a bullish move.
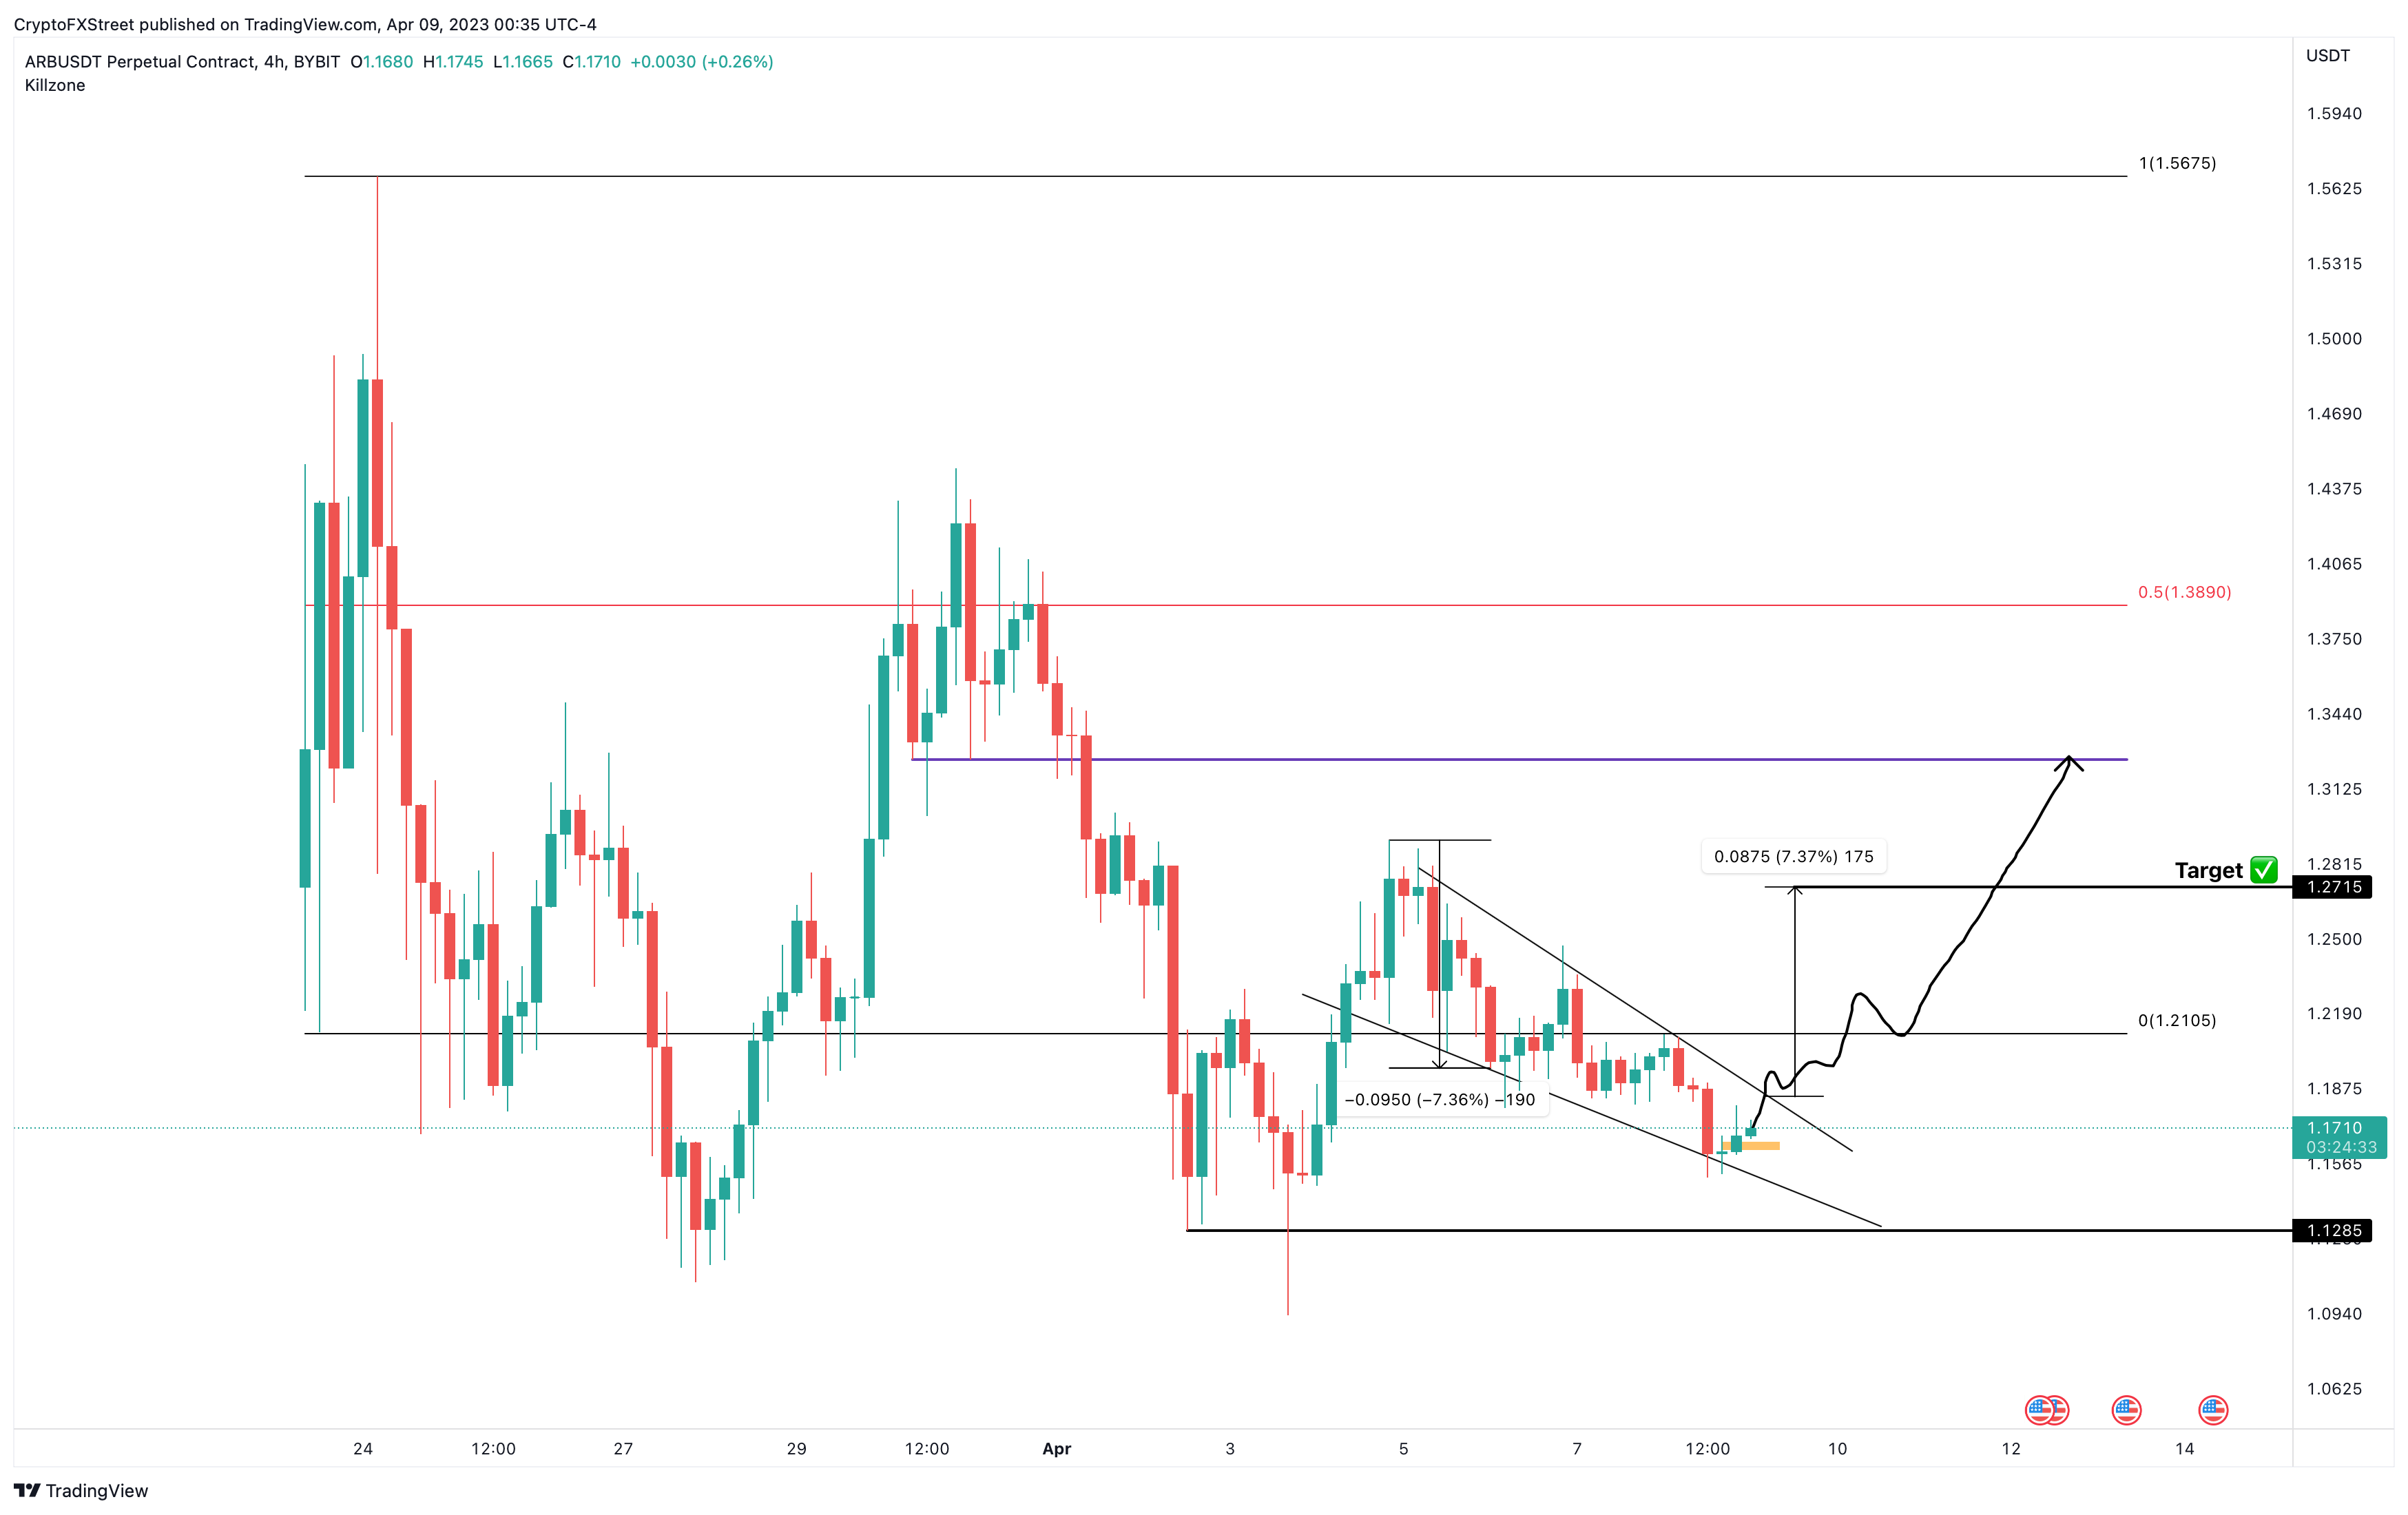
- A breakout from this setup forecasts a 7% upswing that could extend up to $1.32.
- Invalidation of the bullish thesis will occur if ARB produces a lower low below the $1.12 support level.

Arbitrum price shows a tight consolidation that could result in a quick recovery rally. ARB holders need to pay close attention to a flip of one key hurdle into a support level, which could add fuel to the breakout.
Arbitrum price takes its time
Arbitrum price has formed three lower highs and two lower lows between April 4 and 9. Connecting these swing points using trend lines reveals a falling wedge setup. This technical formation forecasts a 7% upswing to $1.27, obtained by adding the distance between the first swing high and swing low to the breakout point at $1.18.
While this breakout makes sense from a theoretical standpoint, Arbitrum price needs to overcome the $1.21 hurdle for a swift move to the upside.
A successful move could trigger Arbitrum price to retest the $1.32 level, which would constitute a 12% upswing from the current position.
ARB/USDT 1-hour chart
While the outlook explained above for Arbitrum price makes logical sense, investors need to pay close attention to the $1.21 hurdle. A rejection here could be a make-or-break moment for ARB holders.
A four-hour candlestick close below the $1.12 support level will create a lower low and invalidate the bullish thesis for Arbitrum price. In such a case, ARB could try to form a second bottom around April 3, swing low at $1.09 or slide lower to create a new all-time low.
Author

Akash Girimath
FXStreet
Akash Girimath is a Mechanical Engineer interested in the chaos of the financial markets. Trying to make sense of this convoluted yet fascinating space, he switched his engineering job to become a crypto reporter and analyst.


