ApeCoin price sets for a rally following a break above descending trendline
- ApeCoin price breaks above a descending trendline, suggesting a break in the market from bearish to bullish.
- On-chain data shows that APE's capitulation event occurred on July 17.
- A daily candlestick close below $0.770 would invalidate the bullish thesis.

ApeCoin (APE) price broke above a descending trendline on Tuesday and rose 1% the next day. As of Thursday, it trades slightly up at the $0.83 area. On-chain data shows that APE's capitulation event occurred on July 17, suggesting a rally in ApeCoin price in the upcoming days.
ApeCoin price shows potential for a bullish move
ApeCoin price broke above a descending trendline drawn from March 13 high on Tuesday and rose 1% the next day. As of Thursday, it trades slightly up on the day at the $0.83 area.
If the trendline holds as pullback support around the $0.770 level, APE could rally 42% from there to retest its 61.8% Fibonacci retracement level at $1.096 drawn from aswing high of $1.367 on June 5 to a swing low of $0.656 on July 5.
The Relative Strength Index (RSI) and the Awesome Oscillator (AO) indicators on the daily chart are below their neutral levels of 50 and zero, respectively. If bulls are indeed making a comeback, then both momentum indicators must maintain their positions above their respective mean levels. Such a development would add a tailwind to the recovery rally.
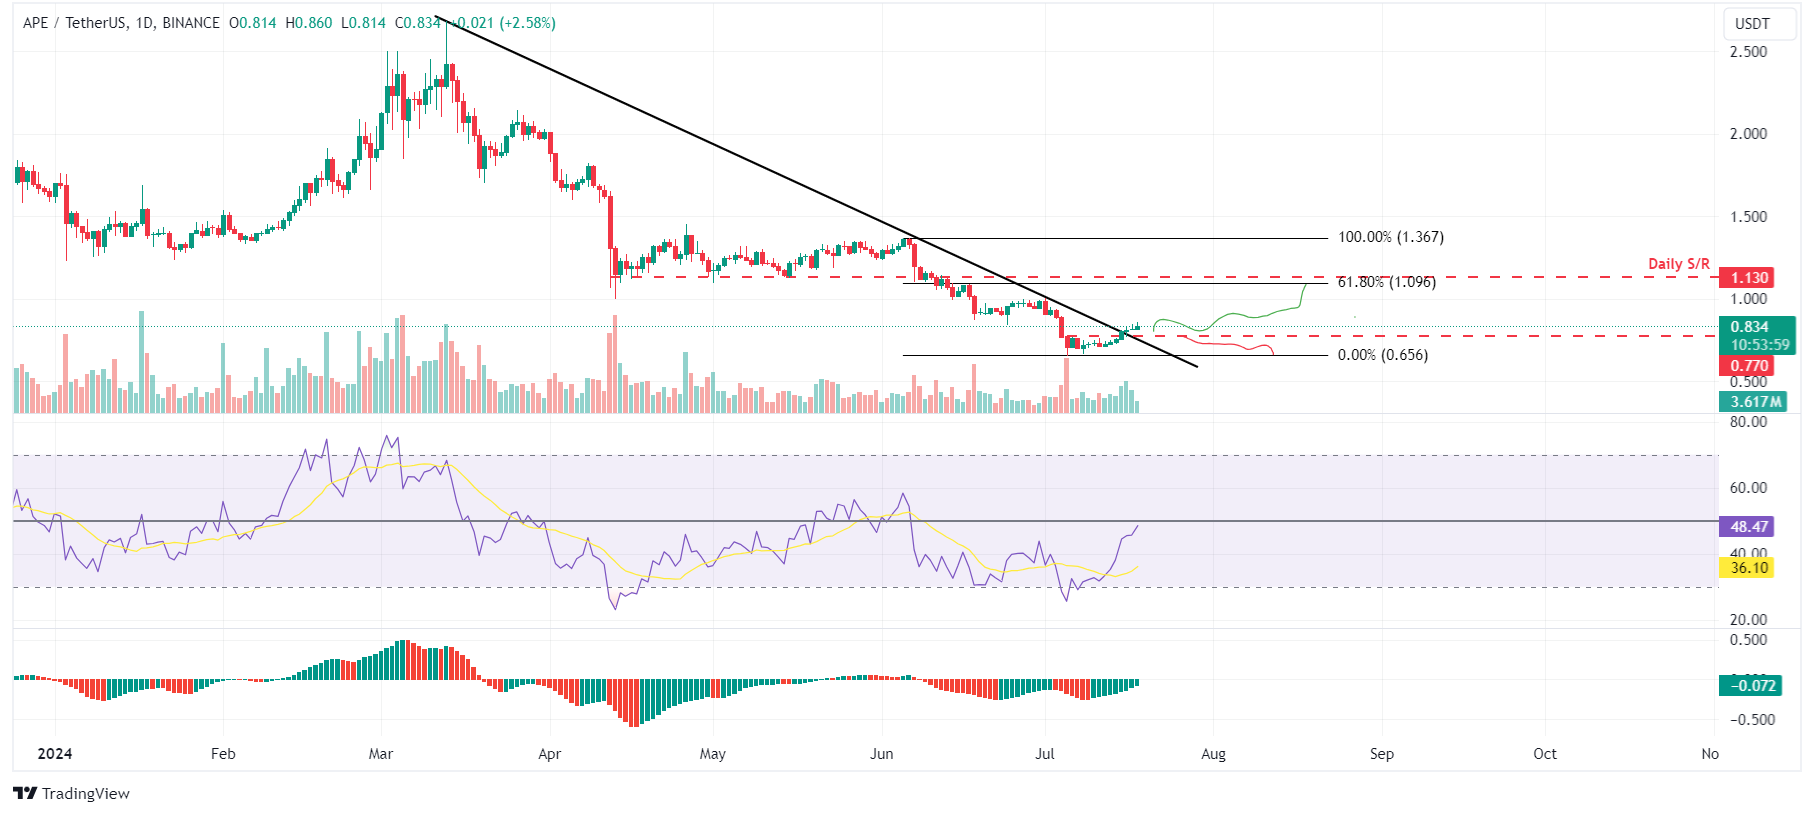
APE/USDT daily chart
Based on IntoTheBlock's In/Out of the Money Around Price (IOMAP), nearly 295 addresses accumulated 6.66 million APE tokens at an average price of $0.809. These addresses bought ApeCoin between $0.790 and $0.812, which makes it a key support zone. These investors will likely add more to their holdings if the price retraces.
Interestingly, the $0.790 to $0.812 zone mentioned from a technical analysis perspective coincides with the IOMAP findings, making this zone a key reversal area to watch.
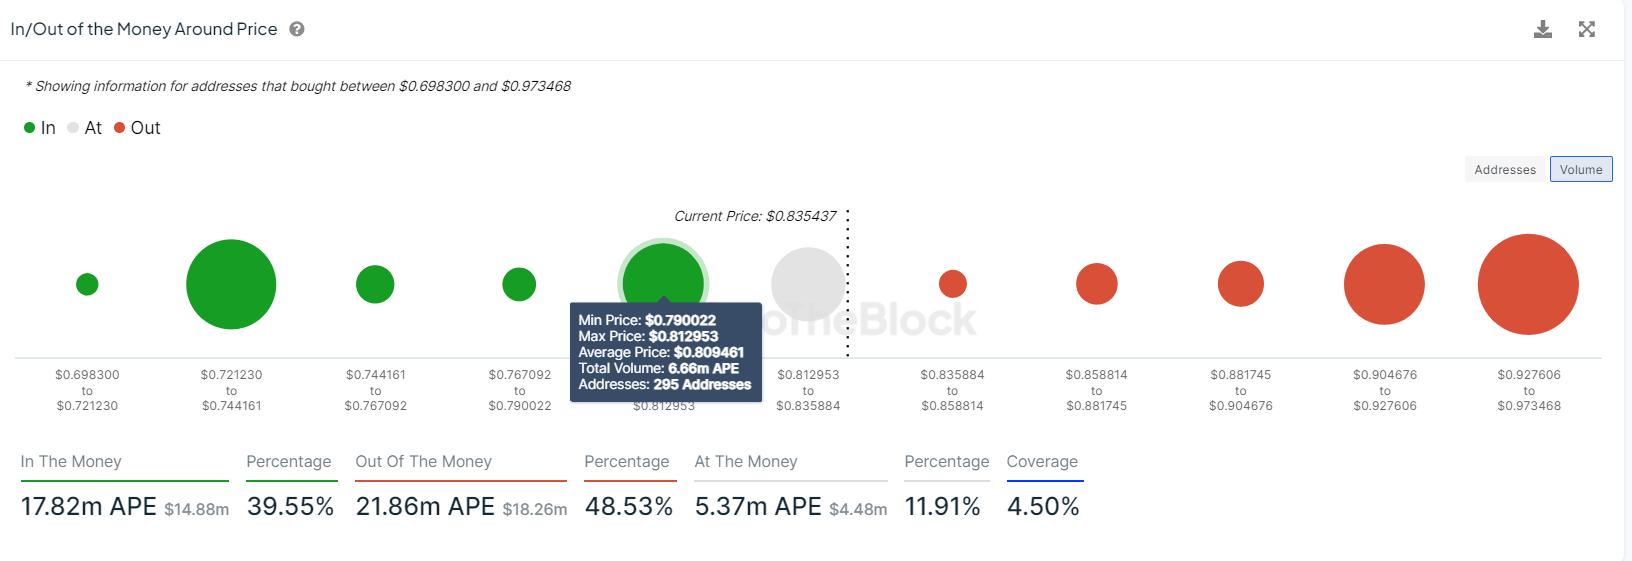
APE IOMAP chart
On-chain data provider Santiment's Network Realized Profit/Loss (NPL) indicator computes a daily network-level Return On Investment (ROI) based on the coin's on-chain transaction volume. Simply put, it is used to measure market pain. Strong spikes in a coin's NPL indicate that its holders are, on average, selling their bags at a significant profit. On the other hand, strong dips imply that the coin's holders are, on average, realizing losses, suggesting panic sell-offs and investor capitulation.
In APE's case, the NPL indicator slumped from -243,630 to -3.75 million on Wednesday. This massive negative downtick indicates that the holders are, on average, realizing losses.
On the other hand, during this capitulation event, the APE's supply on exchanges, which has continued to fall since July 12, decreased by 3.6%. This development indicates that investors are removing APE tokens for exchanges to store in their wallets, which reduces the selling activity and further denotes their confidence in ApeCoin.
%20[18.30.06,%2018%20Jul,%202024]-638569103320751006.png)
APE Network Realized Profit/Loss and Supply on Exchanges chart
However, if ApeCoin's daily candlestick closes below $0.770 and establishes a lower low on the daily timeframe, it may signal a shift in market dynamics that favors bearish sentiment. Such a change could nullify the bullish outlook, leading to a 15% crash in APE's price to retest the low of July 5 at $0.656.
Author

Manish Chhetri
FXStreet
Manish Chhetri is a crypto specialist with over four years of experience in the cryptocurrency industry.


