Algorand Price Forecast: ALGO prepares for 25% rally towards $87
-
Algo price is coiling into a terminal diagonal triangle pattern.
-
The Relative Strength Index is displaying bullish divergence.
-
Traders should remain cautious as the consolidation may not be over.

Algorand price has been one of the more bearish cryptocurrencies this week as the price has printed the lowest low all month at $66. Despite the bearish grip, the 12-hour chart says the current downtrend could be coming to an abrupt end.
Algorand price is due for a move.
Algorand price is coiling into what appears to be a terminal diagonal pattern. According to the Elliott Wave theory, terminal diagonal patterns usually indicate trend weakness and forecast a future counter-trend rally. It is worth noting that terminal triangles usually have complex overlapping structures.
Algorand price has articulated erratic behavior since the end of January. The overlapping price structure on the 12-hour chart also coincides nicely with the Relative Strength Index, which has been printing divergent higher lows from the Algorand price. The Elliott Wave theory also permits analysts to use the diagonal origin point into the apex to calculate future price targets. Thus a 25% move into $87 move could occur sometime soon.
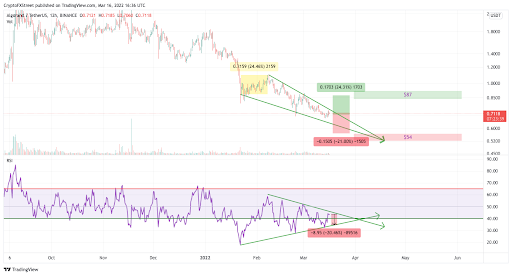
ALGORAND/USDT 12-Hr Chart
It is also worth noting that the Relative Strength Index does have 21% of unchartered territory by the current Algorand price. A 21% drop in price would bring Algo price back into the $54.00 zone. A drop into these lows would not invalidate this thesis, as C waves can be very complex in their own right.
A bearish impulse wave past 25% will be the first invalidation for the wedging terminal diagonal pattern. The diagonal pattern has either completed wave C and will march upwards to complete wave D at $87 for a 25% run. Or the entire diagonal is already complete, and a more significant uptrend is underway with targets past $87, perhaps even $100.
Author

FXStreet Team
FXStreet
Composed of a group of economic journalists and FX experts, the FXStreet content team produces and oversees all content published on FXStreet. It provides a purely journalistic approach to the Forex market.



