Algorand Price Analysis: ALGO faces imminent pullback as overhead pressure intensifies
- Algorand's recovery within the ascending channel hit a massive barrier at $1.4.
- Correction from the prevailing market value to seek support at $1.2 and $1, respectively.
- The MACD cross into the positive territory is a bullish signal, showing that bulls influence the price.

Algorand has sustained a gradual uptrend after the price drop in February. Acute resistance at $1.4 cut short the uptrend, bringing to light the possibility of more correction. At the time of writing, ALGO is exchanges hands at $1.3 amid intensifying selling pressure.
Algorand's breakdown could be massive
The token is trading within the confines of an ascending parallel channel. The channel's upper boundary has limited upward price action. As long as this resistance stays intact, ALGO will drop appreciably, perhaps retest the channel's middle boundary support.
On the downside, formidable support is highlighted at $1.2 by the 200 Simple Moving Average (SMA) on the 4-hour chart. If push comes to shove, the bearish leg may extend to the channel's lower edge.
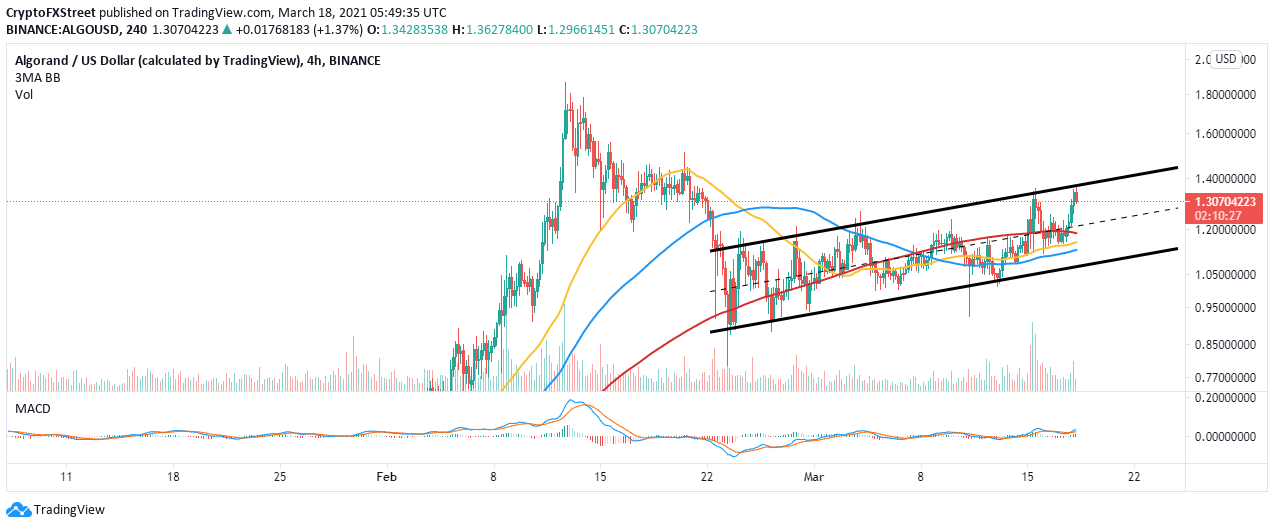
ALGO/USD 4-hour chart
Looking at the other side of the picture
Algorand has a bullish impulse, according to the SuperTrend indicator. A recent signal suggested to traders to take a long position in Angorand. The call to buy came after an extended consolidation period. If the SuperTrend indicator stays in the same position, ALGO will likely trend higher or sustain consolidation at a higher price level.
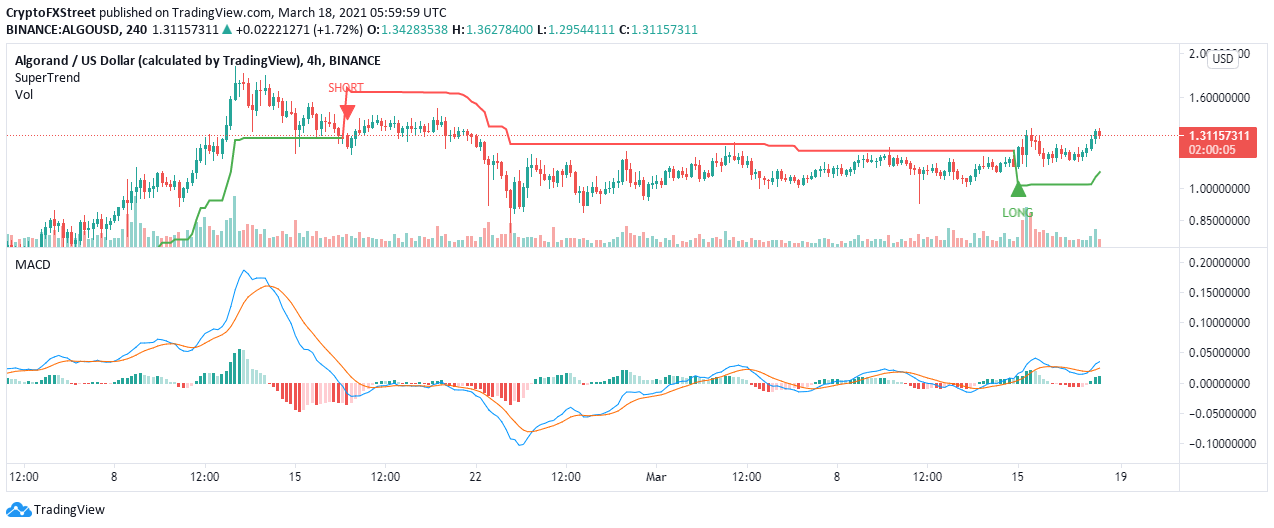
ALGO/USD 4-hour chart
The Moving Average Convergence Divergence (MACD) also reinforced the bullish narrative. This indicator is known for identifying positions to buy the bottom and sell the top. With the indicator in the positive region, the midline and the MACD line (blue) increasing the divergence above the signal line. In other words, Algorand is still in the bulls' hands, and the uptrend has the likelihood of continuing.
Author

John Isige
FXStreet
John Isige is a seasoned cryptocurrency journalist and markets analyst committed to delivering high-quality, actionable insights tailored to traders, investors, and crypto enthusiasts. He enjoys deep dives into emerging Web3 tren


