|

Algorand price is sealed between two critical levels awaiting potential 24% move

  • Algorand price is contained inside an ascending triangle pattern.
  • The digital asset is on the verge of a 24% move.
  • The significant decrease in trading volume reveals that ALGO should see a significant move soon.

Algorand price has been trading below a critical resistance level and formed an ascending triangle pattern on the 12-hour chart

Algorand price on the verge of a massive move

On the 12-hour chart, the most significant pattern is the ascending triangle which is on the verge of a breakout or breakdown. The key resistance trendline is formed at $1.18 and ALGO is currently trading at $1.14.

algo price

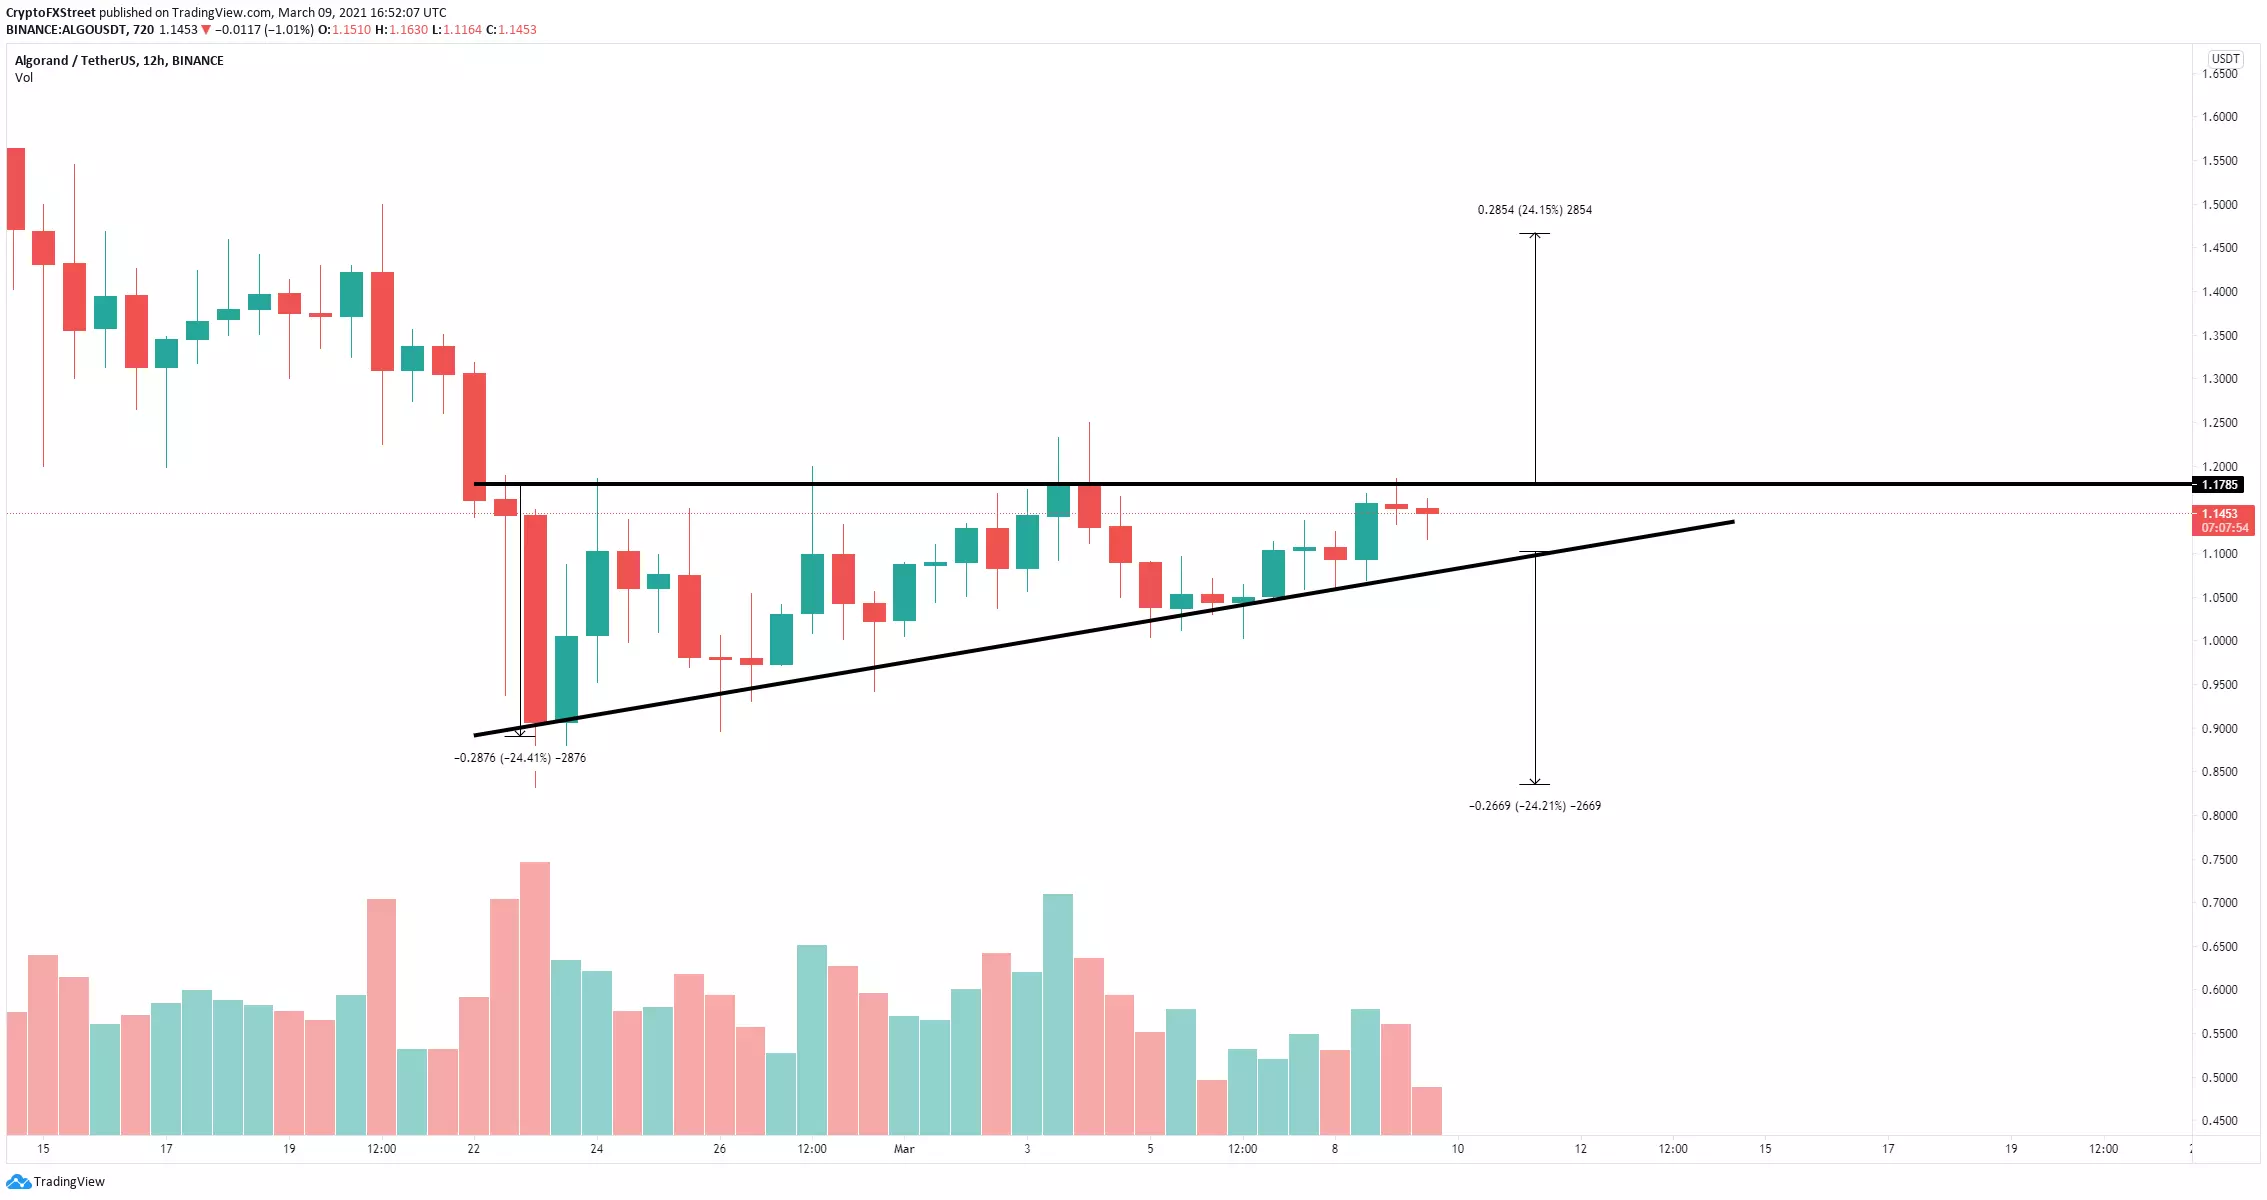
ALGO/USD 12-hour chart

A breakout above $1.14 should quickly push Algorand towards $1.47, a 24% move calculated using the height of the pattern as a reference point.

However, it’s also possible for Algorand price to get rejected at the upper boundary of the pattern and get pushed towards the lower trendlin at $1.1. A breakdown below this point will drive ALGO towards $0.84.

Author

Lorenzo Stroe

Lorenzo Stroe

Independent Analyst

Lorenzo is an experienced Technical Analyst and Content Writer who has been working in the cryptocurrency industry since 2012. He also has a passion for trading.

More from Lorenzo Stroe
Share:

Editor's Picks

Crypto Today: Bitcoin, Ethereum, XRP recovery slows amid incessant capital outflows

The cryptocurrency remains in a broader corrective bias on Friday, despite majors such as Bitcoin (BTC), Ethereum (ETH), and Ripple (XRP) holding slightly higher than early-week support levels.

Cardano: Whale selling, cautious derivatives limit ADA rebound

Cardano is trading near $0.170 at the time of writing on Friday after staging a modest rebound from last week's sharp correction. However, the recovery remains fragile as large holders have resumed reducing their positions, adding fresh selling pressure to ADA.

Experts agree: Bitcoin nears bottom, but weak demand raises doubts

Bitcoin (BTC) is trading above $63,000 at the time of writing on Friday after rebounding from the key 200-week Simple Moving Average (SMA) near $62,000, a level widely viewed as key long-term support.

Pi Network Price Forecast: Bulls attempt comeback as bearish strength fades

Pi Network is trading at around $0.120 on Friday after a modest recovery the previous day. Despite this recent rebound, traders should be cautious as a scheduled unlock of 14.8 million PI tokens on Friday could limit the token's recovery potential by increasing market supply.

Experts agree: Bitcoin nears bottom, but weak demand raises doubts
Bitcoin (BTC) is trading above $63,000 at the time of writing on Friday after rebounding from the key 200-week Simple Moving Average (SMA) near $62,000, a level widely viewed as key long-term support. The recovery may suggest that Bitcoin has found a floor after a sharp correction that spanned more than a month, but some warning signs persist.