Algorand Price Forecast: ALGO has a clear path towards a 25% upswing
- Algorand price is contained inside an ascending triangle pattern on the 4-hour chart.
- Only one key resistance level separates ALGO from a 25% breakout.
- However, the digital asset could face short-term selling pressure according to on-chain metrics.

Algorand has been trading sideways for the most part but could be on the verge of a massive move, according to various indicators. The digital asset faces only one key resistance level and seems to have enough momentum behind it.
Algorand price aims for a breakout to $1.5
On the 4-hour chart, Algorand has formed an ascending triangle pattern with its resistance trendline established at $1.18. A breakout above this point will quickly drive Algorand price towards $1.5, a 25% move calculated using the height of the pattern.
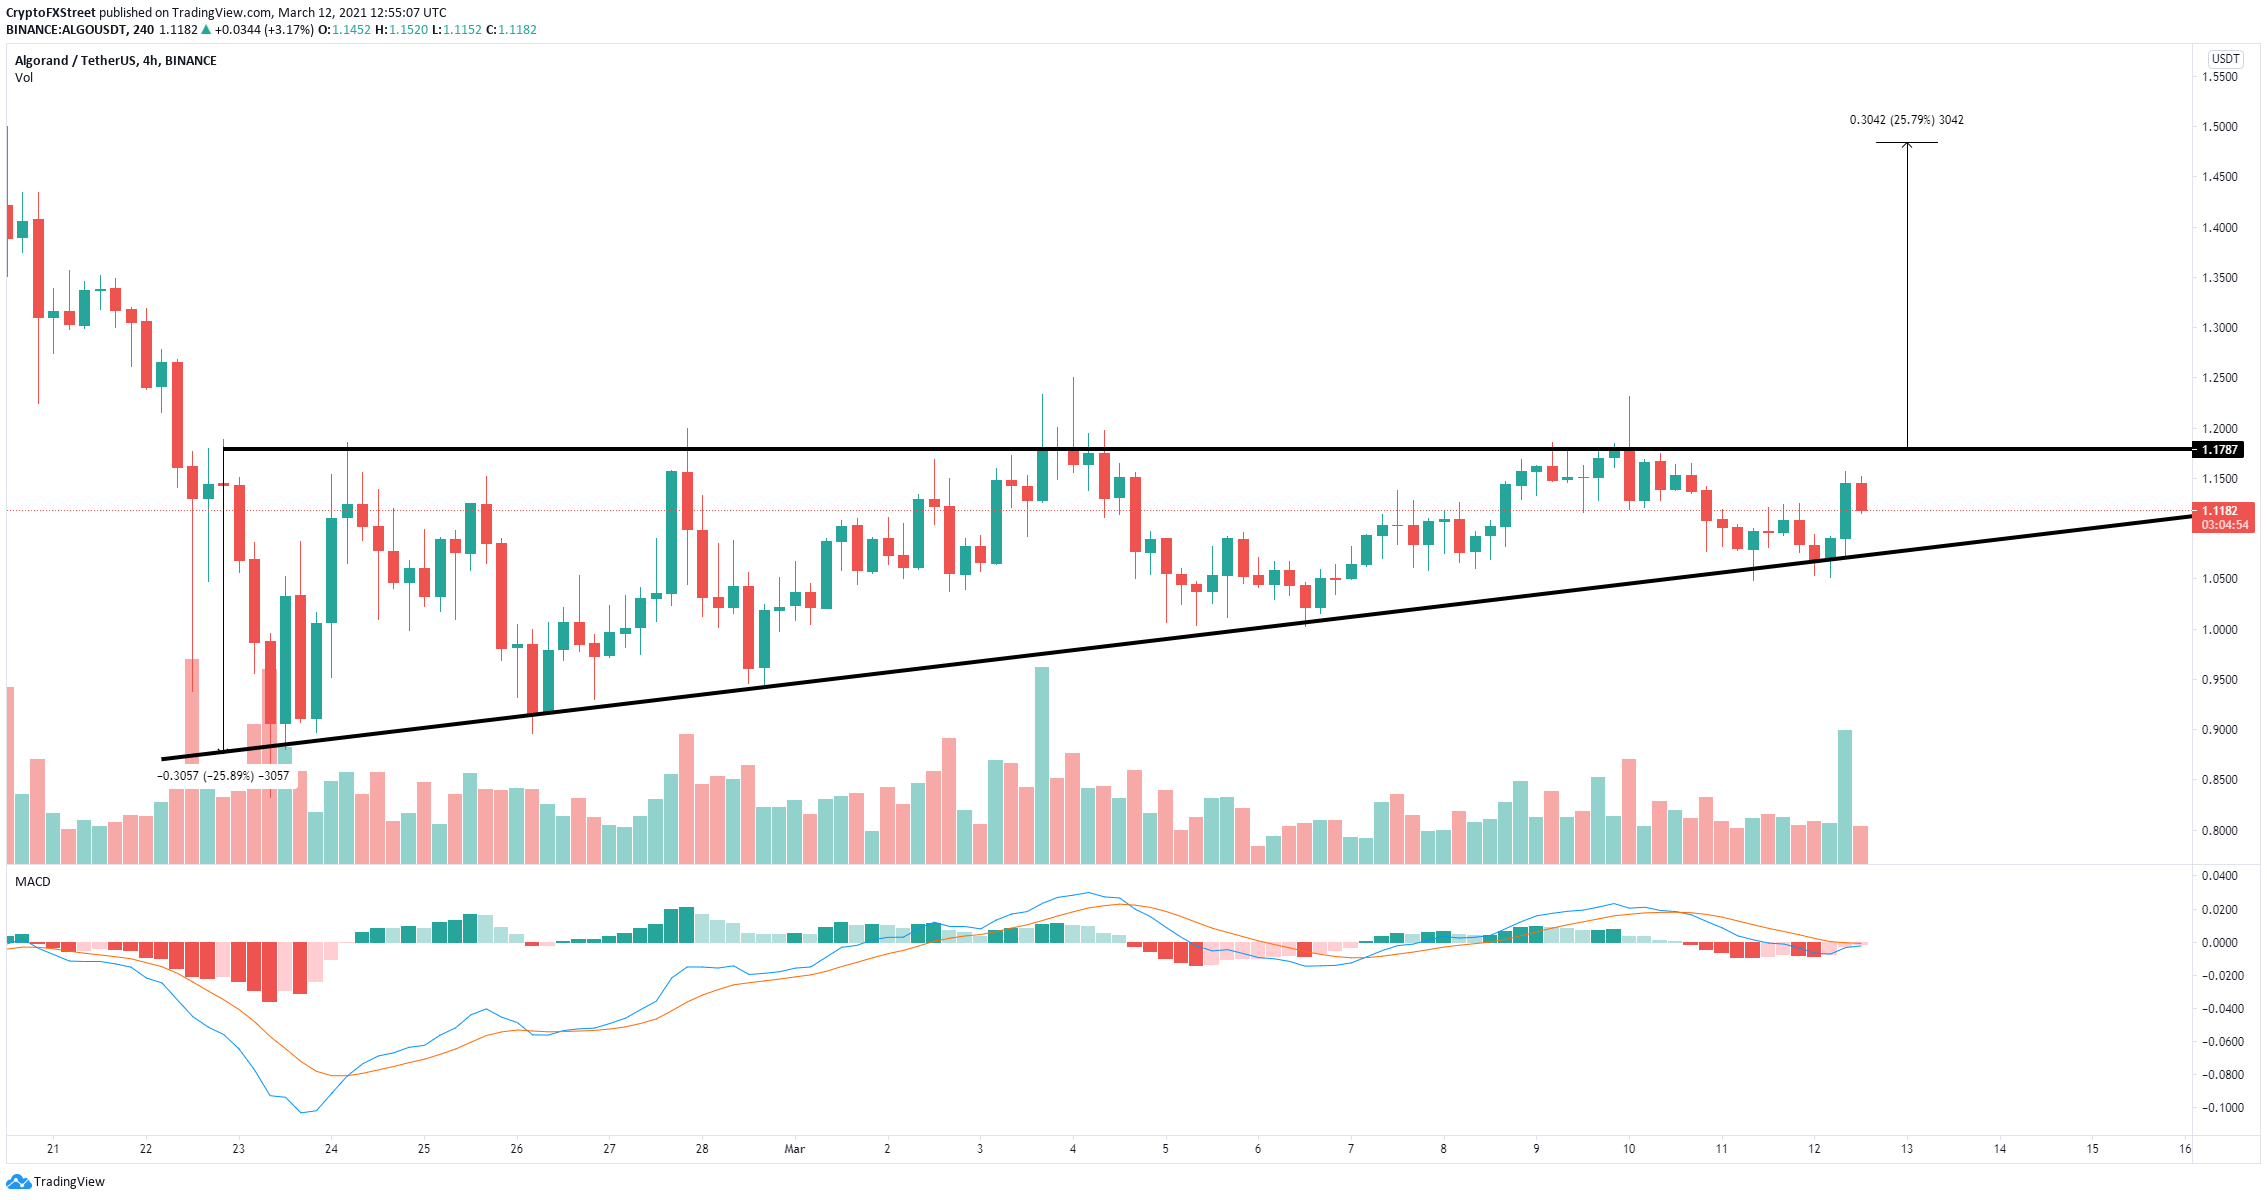
ALGO/USD 4-hour chart
Less than 24 hours ago, Algorand held the lower trendline support, and the MACD is on the verge of a bullish cross for the first time since March 7, which adds more credence to the theory discussed above.
%20[13.56.10,%2012%20Mar,%202021]-637511506797820277.png)
ALGO Social Volume
However, the social volume of Algorand remains quite high, and we have seen several spikes in the past week, which usually indicate that ALGO is on the verge of a correction like it happened on March 3 or February 12. A breakdown below $1.07 will push Algorand price down by about 25%
Author

Lorenzo Stroe
Independent Analyst
Lorenzo is an experienced Technical Analyst and Content Writer who has been working in the cryptocurrency industry since 2012. He also has a passion for trading.


