Algorand bears celebrate as ALGO enteres new downtrend
- Algorand down -22% from weekly highs.
- Algorand has another -20% to go.
- Bulls trapped, accelerating sell-off.

Algorand price faces a reduction in volume interest at all-time highs. Late-term buyers above $2.00 now experience increased pressure to sell as Algorand slowly and painfully loses value. Selling pressure is likely to continue.
Algorand price faces continued and accelerated selling pressure, return to $1.60 in play
Algorand price has made some insane moves this week. From the open of the weekly candlestick, bulls pushed up as much as +27% only to have sellers step in and retrace over 100% of that entire move. The current weekly candlestick is one of the most bearish candlestick patterns in Japanese candlestick analysis: Gravestone Doji.
Late buyers above the $2.00 – and specifically, the $2.20 range – are increasingly under pressure and feeling the pinch as their positions become more and more in the red. If bears continue to put sell pressure on Algorand price, there probably be a mini flash-crash below the weekly low of $1.8620.
The target zone for support is the $1.60 value area. This is the 50% Fibonacci retracement level as well as the weekly Tenkan-Sen and Kijun-Sen levels. Perhaps more than any other factor, the gap between the current close and the weekly Tenkan-Sen is why a fast drop towards $1.60 is likely.
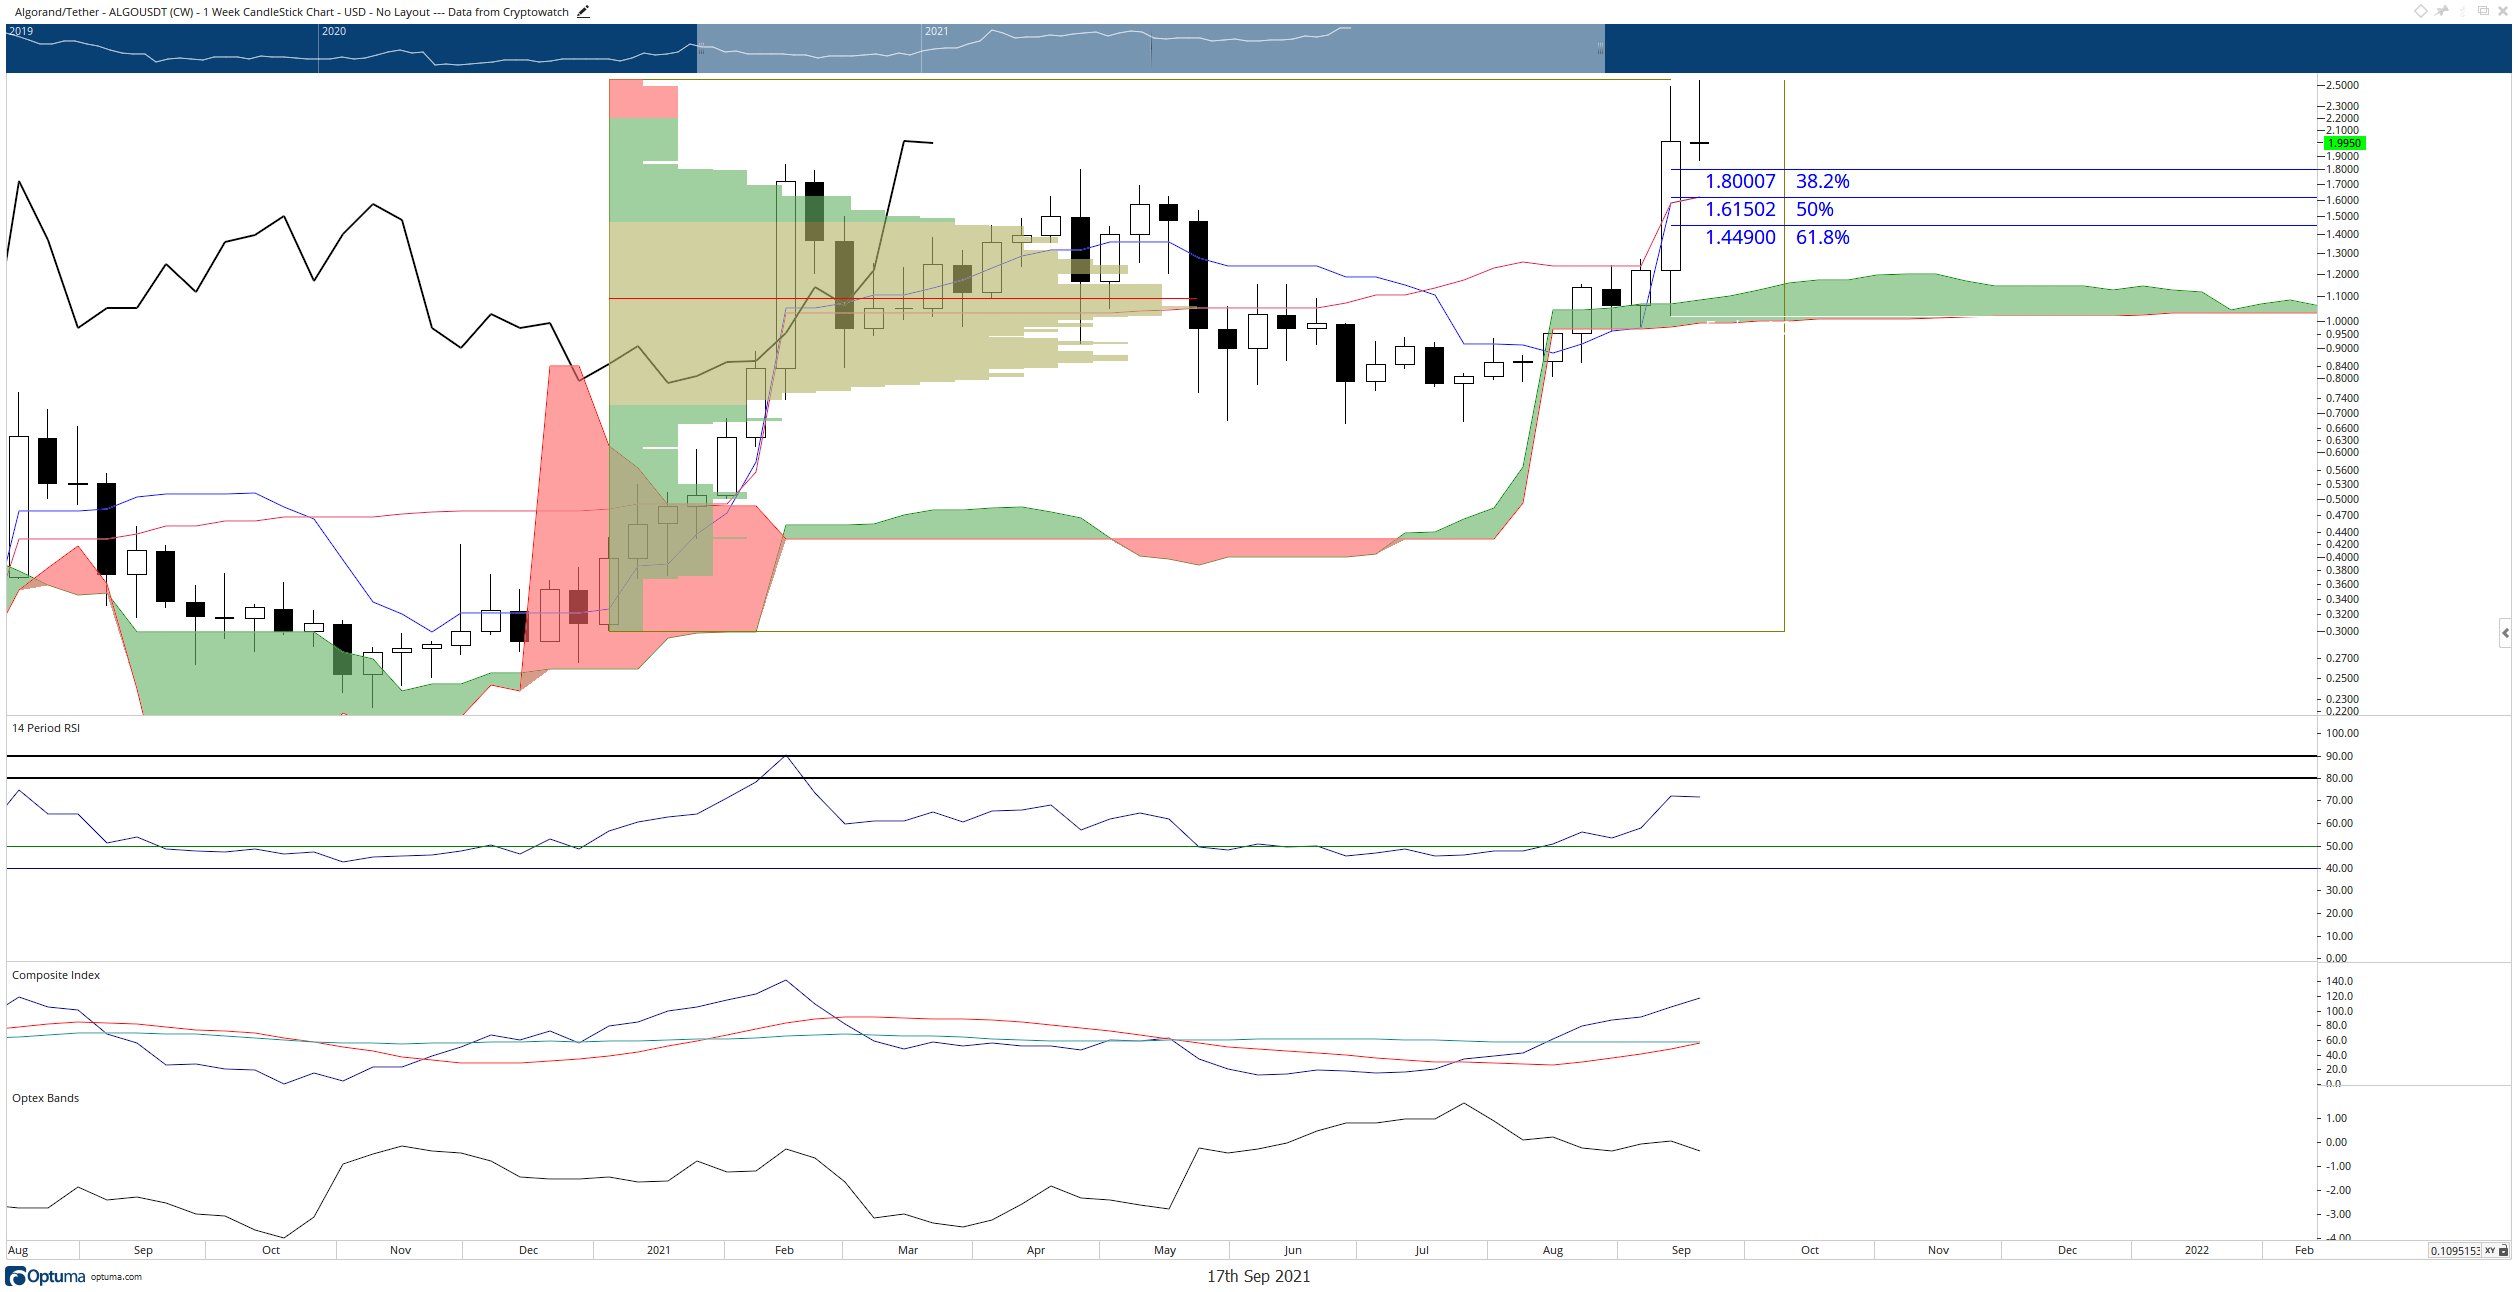
Algorand/USDT Weekly Ichimoku Chart
The oscillators confirm likely downside pressure and that it will likely be sustained. The Relative Strength Index topped out a little below the first oversold condition at 80. Between the candlestick chart and the Composite Index, there are some discrepancies. There are higher highs on the candlestick chart but lower highs on the Composite Index – a condition known as regular bearish divergence.
For bulls to invalidate any current bearish sentiment, they need to push the Algorand price back to the all-time highs and maintain price at those levels to develop a new support zone.
Author

Jonathan Morgan
Independent Analyst
Jonathan has been working as an Independent future, forex, and cryptocurrency trader and analyst for 8 years. He also has been writing for the past 5 years.




