• Litecoin has been stuck between the same support and resistance levels for three months, oscillating between $65 and $46.5.
  • According to price indicators, Litecoin is witnessing a bullish squeeze release, which could propel it towards the 23.6% Fibonacci level.
  • The lack of recovery has led to over 78% of all Litecoin investors witnessing losses on their holdings.

Litecoin might not be the flagbearer of the crypto market like Bitcoin or the constant center of attention like Ethereum and Cardano. However, LTC still manages to make it into the list of cryptocurrencies held by the majority. 

However, the lack of aforementioned factors does make it difficult to induce direct bullishness into LTC’s price action, resulting in an increase in loss-bearing investors.

Litecoin investors continue to wait

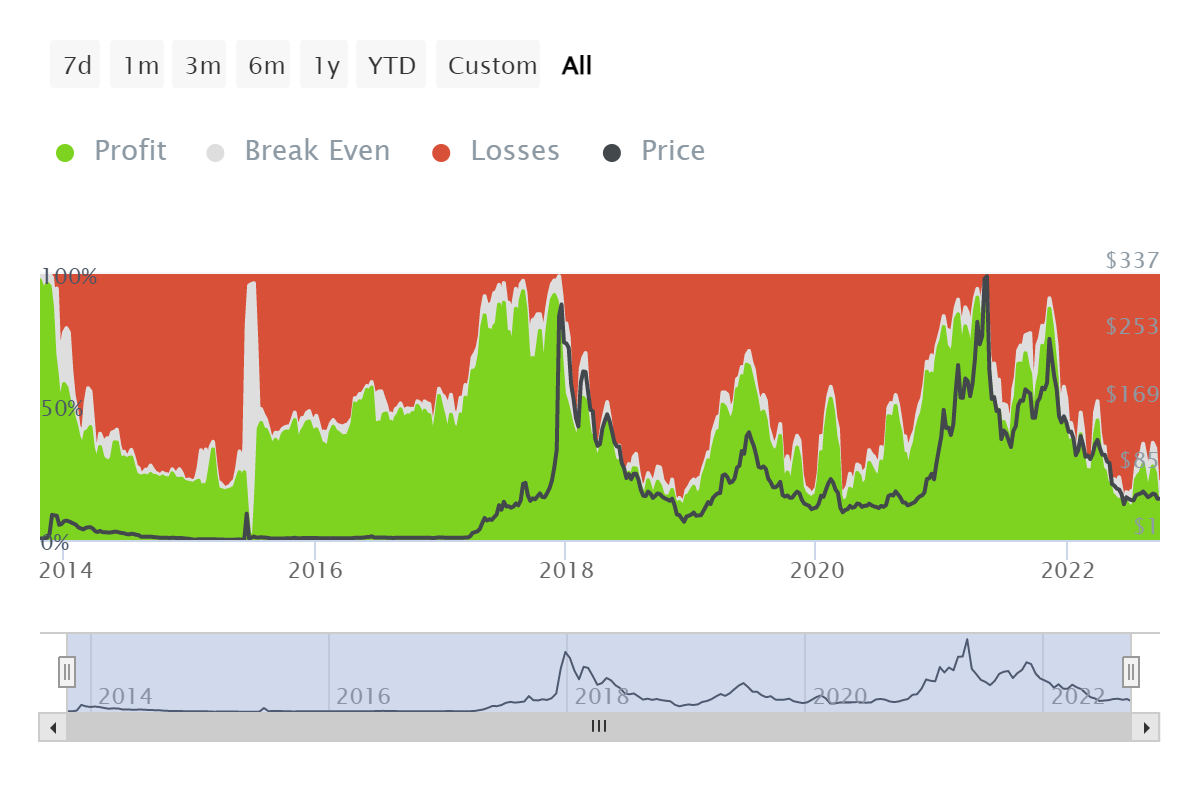
After hitting its all-time high (ATH) back in May 2021, LTC’s price has been conditioned to a downtrend, bringing the altcoin from $334 to trade at $53.43 at the time of writing. 

During this period, the investors that held on to their LTC started incurring losses. As of today, over 5.81 million holders, representing 78.27% of all investors, are holding LTC below the purchase price. 

Litecoin investors in loss

Only 1.02 million addresses are still in profit since these people bought their LTC at a price below $53 anytime before June 2020. 

However, a significant amount of investors could witness profits soon, provided LTC can climb up to $67. About 2.52 million addresses, holding close to 20.3 million LTC combined, are sitting in hopes of a run up to $55 to $67. 

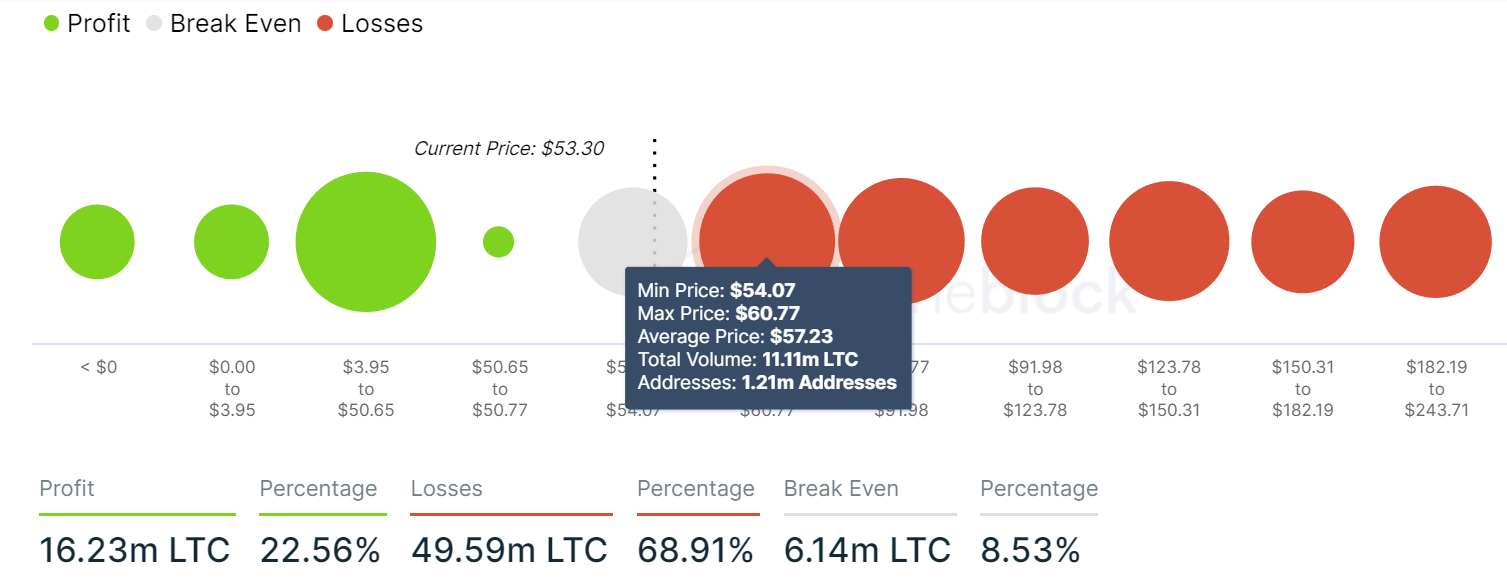
Litecoin's profitable price levels

Since these price ranges are the average price at which these 20.3 million LTC were purchased, a price rise to this point would directly flip $1.2 billion worth of LTC into profit.

When can it happen?

Answering when would be premature since the market is not facing any volatile conditions. In the case of Litecoin, a rally amounting to 21.95% would bring LTC to the critical resistance level, which has been in place for almost five months now.

This resistance level also lies just above the 23.6% Fibonacci Retracement of the $131 to $43 decline. Since this level is considered as crucial support for a bounce off towards recovery of said range, it would certainly bring profits to trapped investors if sustained.

TradingView ChartLitecoin 24-hour price chart

Squeeze Momentum Indicator is currently highlighting a bearish squeeze release (white dots) on the charts, although with declining bearishness. Historically such squeeze releases have been the first sign of trend reversal, and if the same happens this time around as well, it will prove to be beneficial for Litecoin investors.


Information on these pages contains forward-looking statements that involve risks and uncertainties. Markets and instruments profiled on this page are for informational purposes only and should not in any way come across as a recommendation to buy or sell in these assets. You should do your own thorough research before making any investment decisions. FXStreet does not in any way guarantee that this information is free from mistakes, errors, or material misstatements. It also does not guarantee that this information is of a timely nature. Investing in Open Markets involves a great deal of risk, including the loss of all or a portion of your investment, as well as emotional distress. All risks, losses and costs associated with investing, including total loss of principal, are your responsibility. The views and opinions expressed in this article are those of the authors and do not necessarily reflect the official policy or position of FXStreet nor its advertisers. The author will not be held responsible for information that is found at the end of links posted on this page.

If not otherwise explicitly mentioned in the body of the article, at the time of writing, the author has no position in any stock mentioned in this article and no business relationship with any company mentioned. The author has not received compensation for writing this article, other than from FXStreet.

FXStreet and the author do not provide personalized recommendations. The author makes no representations as to the accuracy, completeness, or suitability of this information. FXStreet and the author will not be liable for any errors, omissions or any losses, injuries or damages arising from this information and its display or use. Errors and omissions excepted.

The author and FXStreet are not registered investment advisors and nothing in this article is intended to be investment advice.

Recommended content


Recommended Content

Editors’ Picks

Bitcoin Weekly Forecast: Fed-led rally could have legs towards $65,000

Bitcoin Weekly Forecast: Fed-led rally could have legs towards $65,000

Bitcoin has risen 7% so far this week, supported by the US Fed interest-rate cut and more than $300 million in ETFs inflows. The recent surge led BTC price to shatter several key technical resistance levels, a sign that the current two-week rally has likely some more way to go towards $65,000.

More Bitcoin News
Ethereum, BNB and POL holders on the watch as BingX faces loss of $26 million in hack

Ethereum, BNB and POL holders on the watch as BingX faces loss of $26 million in hack

Crypto exchange BingX said on Friday that it suffered a hack, an attack that led to “minimal” losses that researchers at PeckShield estimate at $26.68 million.  The attacker swapped the stolen altcoins for Ethereum, Binance Coin and Polygon tokens, according to on-chain data. 

More Cryptocurrencies News
Pepe price forecast: Eyes for 30% rally

Pepe price forecast: Eyes for 30% rally

Pepe extends the upward movement on Friday after breaking above the descending trendline and resistance barrier on Thursday. PEPE’s dormant wallets are in motion, and the long-to-short ratio is above one, further supporting this bullish move and hinting at a rally on the horizon.

More PEPE News
Shiba Inu is poised for a rally as price action and on-chain metrics signal bullish momentum

Shiba Inu is poised for a rally as price action and on-chain metrics signal bullish momentum

Shiba Inu remains strong on Friday after breaking above a symmetrical triangle pattern on Thursday. This breakout signals bullish momentum, further bolstered by a rise in daily new transactions that suggests a potential rally in the coming days.

More Shiba Inu News
Bitcoin: On the road to $60,000

Bitcoin: On the road to $60,000

Bitcoin price retested and bounced off from the daily support level of $56,000 this week. US spot Bitcoin ETFs posted $140.7 million in inflows until Thursday and on-chain data supports a bullish outlook.

Read full analysis
Moneta Markets review 2024: All you need to know

Moneta Markets review 2024: All you need to know

VERIFIED In this review, the FXStreet team provides an independent and thorough analysis based on direct testing and real experiences with Moneta Markets – an excellent broker for novice to intermediate forex traders who want to broaden their knowledge base.

Read More

BTC

ETH

XRP