Aave Price Technical Analysis: AAVE breakout to $100 lingers
- Aave soars from the last week’s support but hits a barrier under $80.
- The spike in network growth supports AAVE/USD uptrend, but traders must tread carefully.
- A breakout above the resistance range between $80 and $90 could boost Aave significantly above $100.

Aave is up 17% in the last 24 hours, although the decentralized finance token was late in joining the weekend rally. At the time of writing, it seems poised for more upward action as the week kicks off. A spike is anticipated towards $100, mostly if the seller congestion between $80 and $90 is overcome.
Aave seems ready for the final leg to $100
Following the breakdown last week from highs around $84, AAVE/USD embarked on a journey downstream. The declines were triggered by a bearish wave that swept across the market after OKEx exchange resumed withdrawal services for digital assets and cryptocurrencies.
A recovery ensued towards the end of the week, with Aave soaring above $70. At the time of writing, AAVE is trading at $75 amid a gradually building bullish momentum. Resistance is expected between $80 and $90. If broken, the token’s $100 price prediction would be quite conservative.
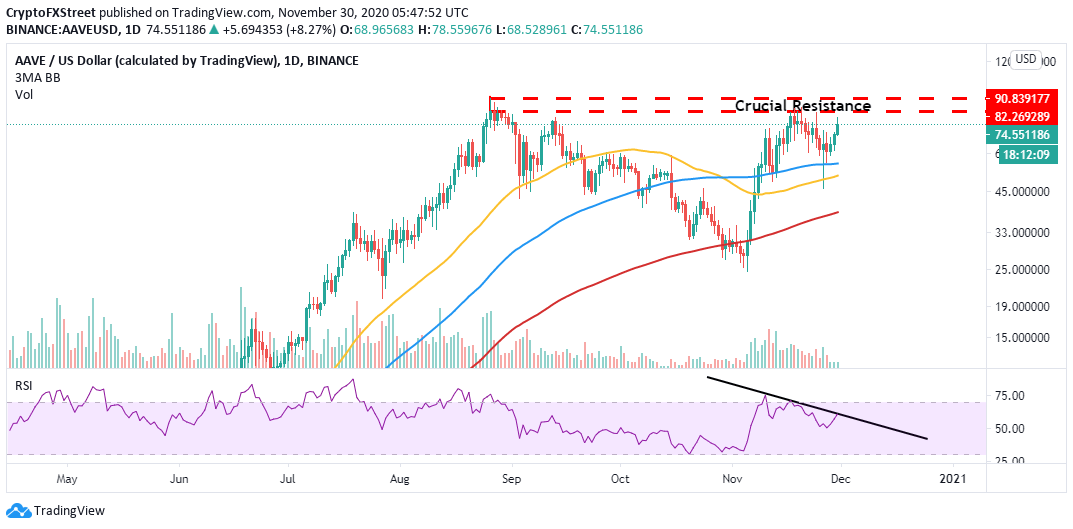
AAVE/USD daily chart
The bullish narrative has been validated by the Relative Strength Index recovery toward the overbought region. A break above the trendline connecting the most recent lower highs could call for more buy orders, as the price is blasted towards $100.
Similarly, the gap made by the 50-day Simple Moving Average above the 100-day SMA and the 200-day SMA reinforced the bulls’ strengthening position in the market.
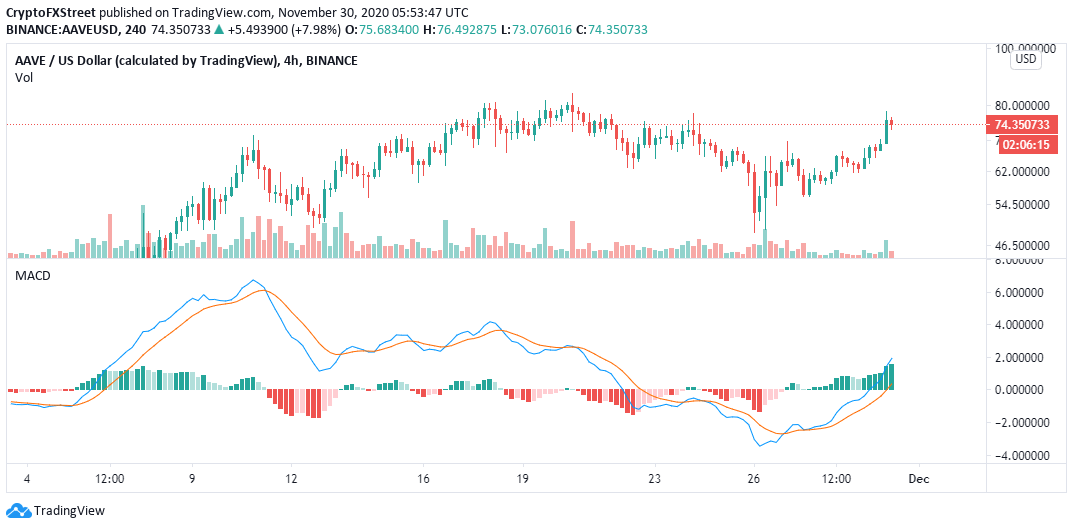
AAVE/USD 4-hour chart
The Moving Average Convergence Divergence has also validated the bullish outlook on the 4-hour chart. The indicator has reclaimed the position within the positive territory, confirming the firm bullish grip. A bullish divergence above the MACD shows that buyers have the upper hand.
On the other hand, Santiment’s network growth, an on-chain metric, emphasizes that AAVE is in a bullish phase. The metric tracks the number of new addresses joining the network each day. A spike in the newly created addresses is viewed as a bullish indicator, as it highlights adoption is on the rise. The token’s price is likely to surge as network growth shoots upwards.
%20[09.04.46,%2030%20Nov,%202020]-637423140783502527.png)
Aave network growth chart
On the flip side, a high network growth can also suggest that the uptrend is nearing the point of correction. Therefore, the spike tells traders to be aware that bears could swing into action.
Similarly, if AAVE fails to break above the hurdle between $80 and $90, the bullish narrative might be sabotaged or take longer to materialize. A break under the 50-day SMA might end up in significant losses toward the next support at $51, as highlighted by the 100-day SMA.
Author

John Isige
FXStreet
John Isige is a seasoned cryptocurrency journalist and markets analyst committed to delivering high-quality, actionable insights tailored to traders, investors, and crypto enthusiasts. He enjoys deep dives into emerging Web3 tren


