Aave Price Forecast: AAVE to face a downturn as multiple technicals turn bearish
- AAVE managed to reach its all-time-high levels this Monday.
- The 12-hour chart has flashed a sell signal with a green-nine candlestick in the TD sequential indicator.

Aave has been on a tear for the last five days. Between November 5 and November 9, the price has jumped from $27.65 to $55.25. In the process, the price managed to reach all-time-high levels. However, technical analysis shows that bears are on the verge of taking control of the market.
Aave bears to take control
AAVE/USDT has flashed the sell signal with a green-nine candlestick in the TD sequential indicator in the 12-hour chart. It looks like the price is going to start a downswing here. The last time the price flashed this indicator, the DeFi lending protocol fell from $32.40 to $26.50 in 15 sessions.
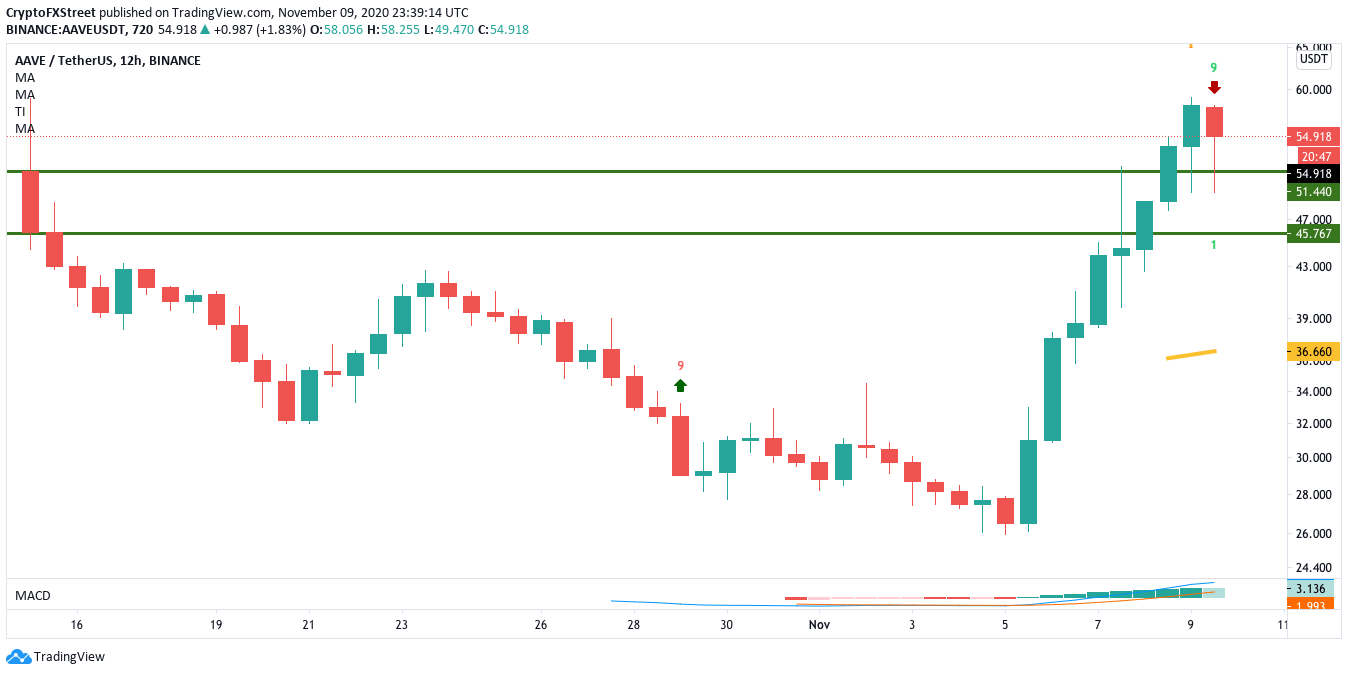
AAVE/USDT 12-hour chart
IntoTheBlock’s In/Out of the Money Around Price (IOMAP) shows two moderate walls at $51 and $46. As such, the bulls will be depending on these walls to stay strong in the event of a downswing. However, intense selling pressure should be able to overcome these levels.
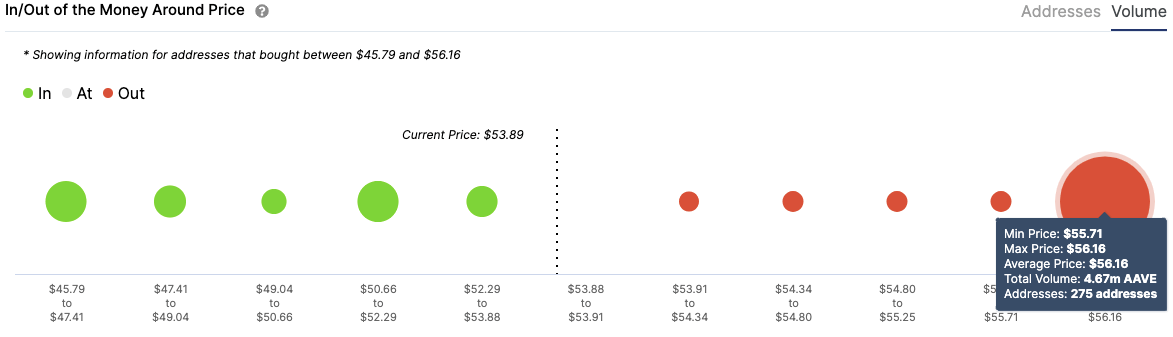
AAVE IOMAP
Adding further credence to the bearish outlook is the daily active addresses metric. As you can see, the number of new addresses entering the protocol over the last three months, reached a high of 654 on November 6 and then went down to 526, at the time of writing. This is a major bearish sign as it shows that the network is weakening.
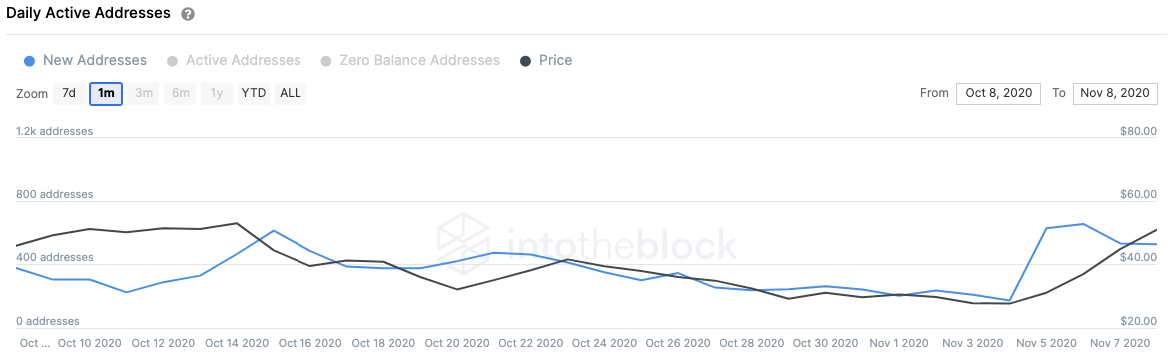
AAVE active addresses
The holder distribution chart shows that the number of addresses holding 100,000 to 1,000,000 tokens has dropped from 457 to 454 over the last three days. It looks like the whales are dumping their holdings to pocket their profits. This is a negative sign which may initiate a further sell-off.
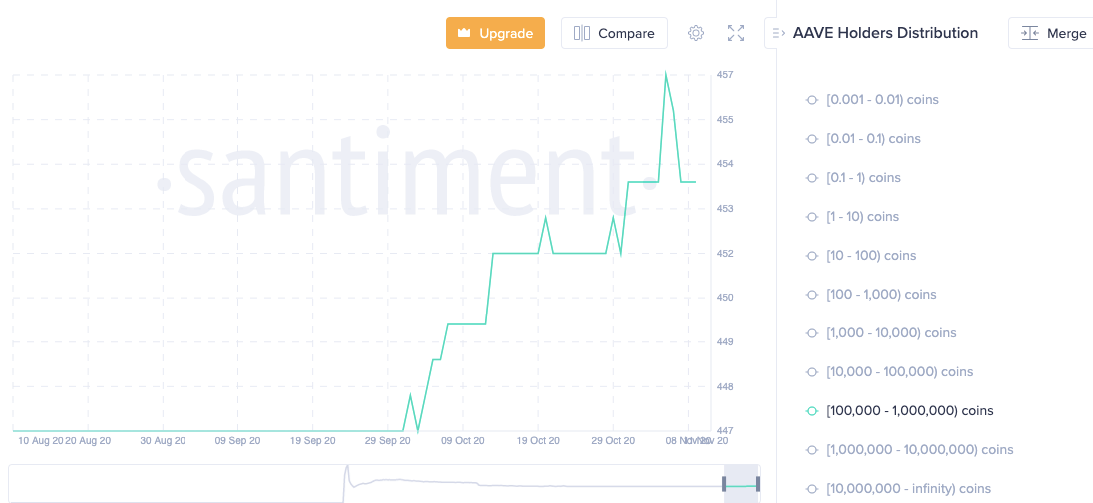
AAVE holders distribution
Currently, the buyers have the freedom to take the price up to $56 before it faces a massive resistance barrier, as visualized by the IOMAP. However, as technicals turn bearish, it looks like the price will go through a downswing. There are two healthy support walls at $51 and $46. A break below these levels will take AAVE down to $35 at the 50-bar SMA in the 12-hour time frame.
Author

Rajarshi Mitra
Independent Analyst
Rajarshi entered the blockchain space in 2016. He is a blockchain researcher who has worked for Blockgeeks and has done research work for several ICOs. He gets regularly invited to give talks on the blockchain technology and cryptocurrencies.


