Aave Price Forecast: AAVE technicals turn bullish, but buyers face one major obstacle
- The parabolic SAR in the 4-hour Aave chart has turned bullish.
- Since late October, a bullish divergence has been forming between AAVE and the RSI within the 4-hour time frame.

Aave fell from $41.65 to $27.75 between October 23 to November 4. Since then, the bulls have pushed the price up to $31. The price is flashing several buy signals that could see the price go up to $50.
Aave technicals bullish
The recent bullish impulse that AAVE went through saw the SAR points turn bullish on the 4hr chart. The parabolic SAR is a useful tool that helps us judge the current trend of the market. It looks like Aave’s market trend has reversed from bearish to bullish in this time frame.
-637402215081875410.png)
AAVE/USDT 4-hour chart
Since late October, a bullish divergence has been forming between Aave’s price and the RSI within the 4-hour time frame. Bullish divergences usually occur when an asset's price makes a series of lower lows while the RSI is making higher lows. It’s another useful metric that shows that the price’s downtrend is approaching exhaustion.
-637402215453459376.png)
AAVE/USDT 4-hour chart
Adding further credence to the bullish outlook is the moving average convergence/divergence (MACD). This tool helps us determine the current market momentum and sentiment. The MACD for the AAVE/USDT 4-hour chart shows increasing bullish market momentum.
-637402215785822824.png)
AAVE/USDT 4-hour chart
IntoTheBlock’s Global In/Out of the Money (GIOM) helps us visualize strong support and resistance levels. The buyers are currently facing a strong resistance barrier at $32, wherein 427 addresses had previously purchased 3.16 million AAVE. If they manage to break past this obstacle, the next viable resistance they face is at $42. Breaking past this should take the DeFi protocol up to $50.
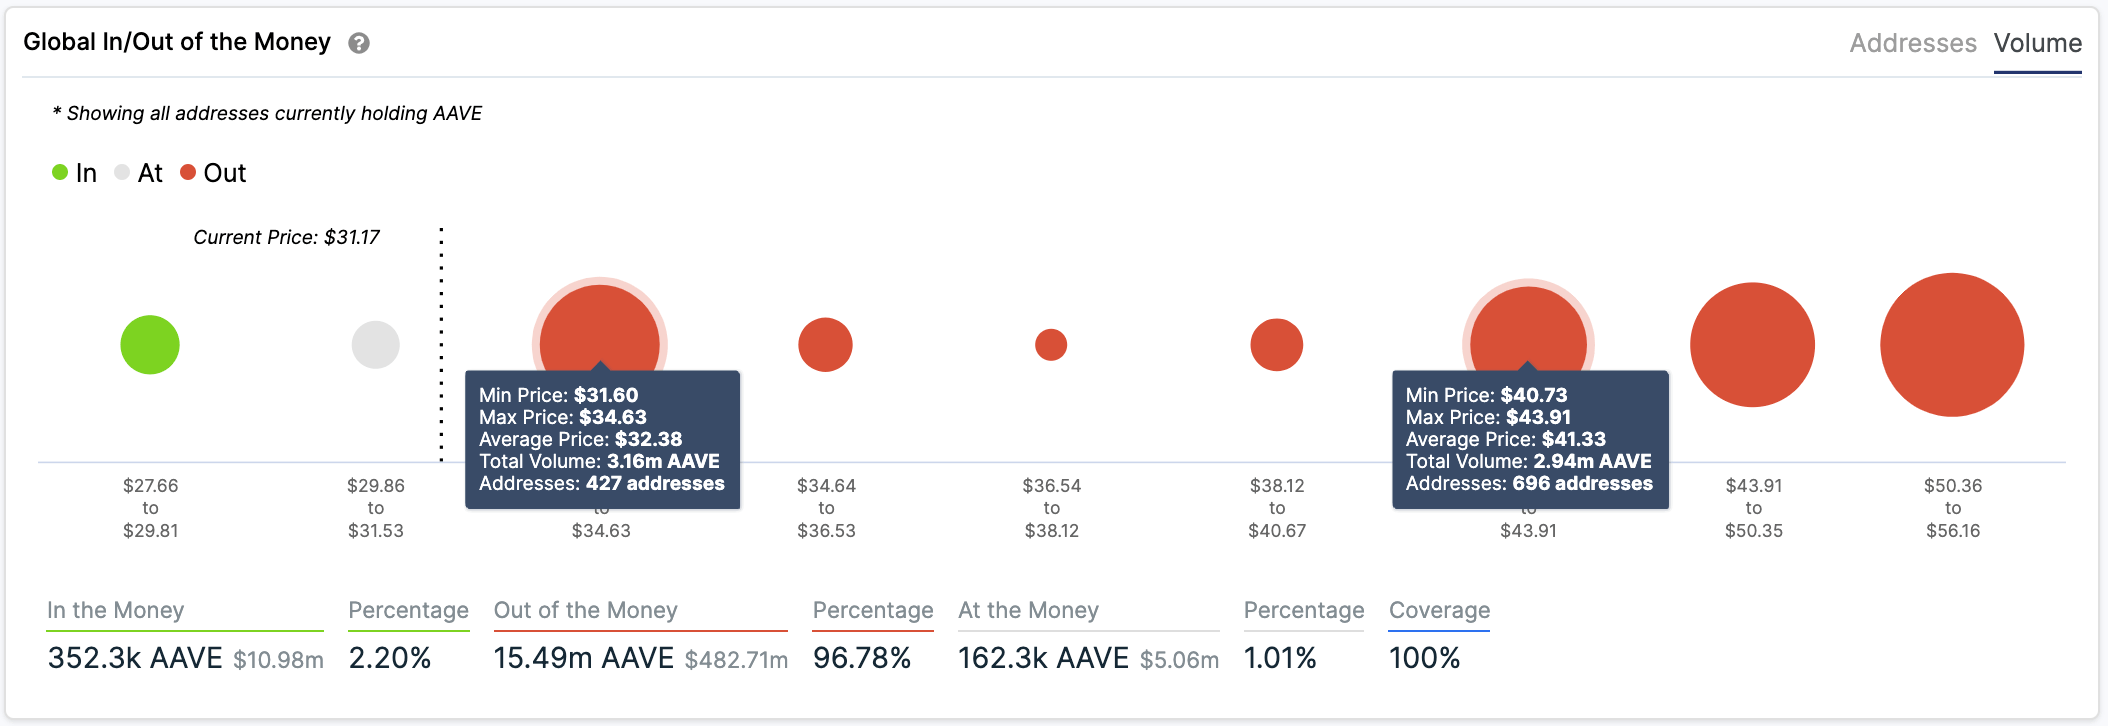
Aave GIOM
Note that this bullish outlook holds only if the buyers manage to hold the price up. The GIOM shows a lack of healthy support walls on the downside. As such, the sellers may manage to take the price down to $25 and spoil the bulls’ party.
Author

Rajarshi Mitra
Independent Analyst
Rajarshi entered the blockchain space in 2016. He is a blockchain researcher who has worked for Blockgeeks and has done research work for several ICOs. He gets regularly invited to give talks on the blockchain technology and cryptocurrencies.


