1INCH price is set for rally, technical indicators and on-chain data show
- 1inch price action shows a bullish divergence on technical indicators, suggesting a rally ahead.
- On-chain data paints a bullish outlook, as 1INCH’s long-to-short ratio is above one, and the exchange flow balance is negative.
- Coinglass data shows that 1INCH’s open interest is rising, indicating new buying is occurring in the market.
- A daily candlestick close below $0.211 would invalidate the bullish thesis.
1inch (1INCH) edges higher and trades above $0.241 at the time of writing on Wednesday, gaining over 8% in the day, and hints at a rally ahead as technical indicators indicate bullish divergence. This bullish thesis is further supported by rising open interest, the long-to-short ratio above one, and the negative exchange flow balance.
1inch token serves as both the governance and utility token for the 1inch Network, which has created a range of DeFi tools, including the Liquidity Protocol, Limit Order Protocol, P2P transactions, and the 1inch Wallet app.
1INCH price could rally as technical indicators show bullish momentum
1inch price bounces off 8% after retesting the August 5 low of $0.222 on Wednesday. Additionally, Wednesday’s lower low on the daily chart does not reflect the Relative Strength Index’s (RSI) higher highs for the same period. This development is termed a bullish divergence and often leads to the reversal of the trend or a short-term rally.
If the $0.211 level holds, 1INCH could rally 21% to retest the August 24 high of $0.291.
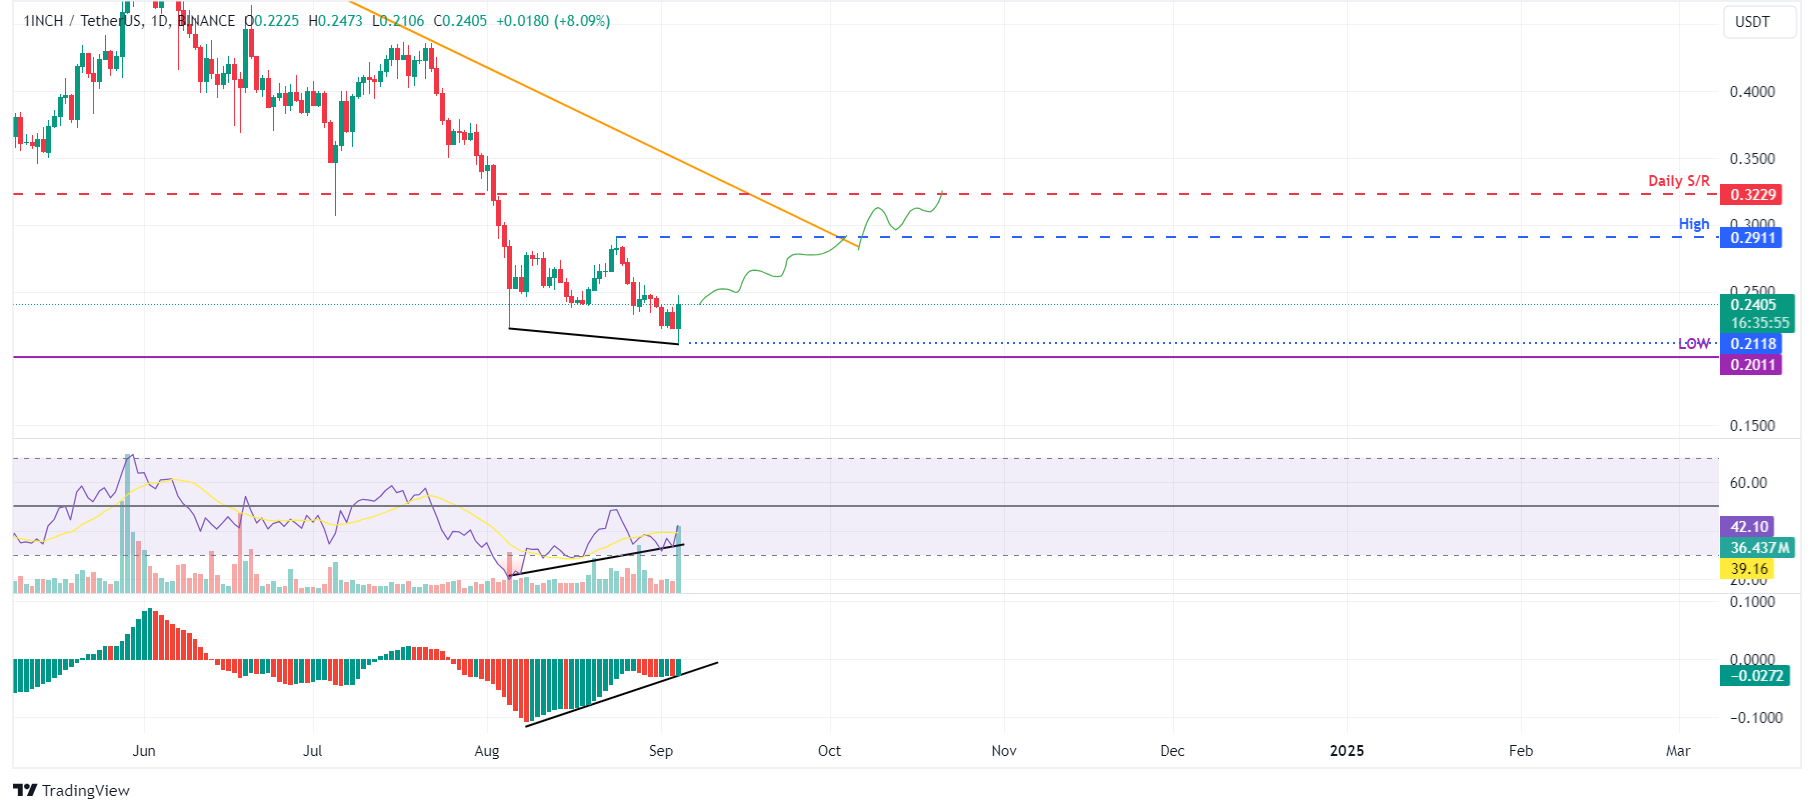
1INCH/USDT daily chart
1inch on-chain data shows positive bias
Coinglass’s data shows that the futures’ Open Interest (OI) in 1inch at exchanges is also increasing. The OI indicates the total number of outstanding derivative contracts that have not been settled (offset by delivery) and whether money flows into the contract are increasing or decreasing.
Increasing OI represents new or additional money entering the market and new buying, which suggests a bullish trend. When OI decreases, it is usually a sign that the market is liquidating, more investors are leaving, and the current price trend is ending.
The graph below shows that 1INCH’s OI increased from $14.57 million on Tuesday to $22.31 million on Wednesday, indicating that new or additional money is entering the market and new buying is occurring.
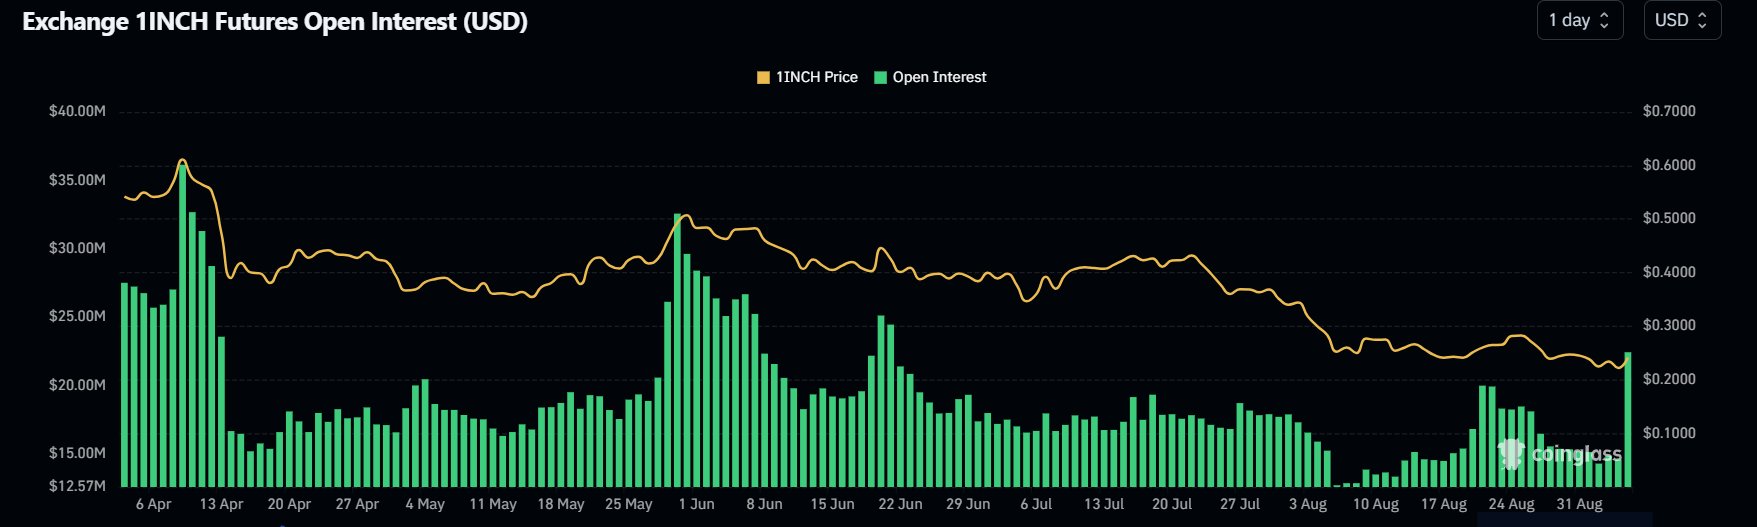
1INCH Open Interest chart
Coinglass’s 1INCH’s long-to-short ratio also stands at 1.07, supporting the bullish outlook. This ratio reflects bullish sentiment in the market, as the number above one suggests that more traders anticipate the price of the asset to rise.
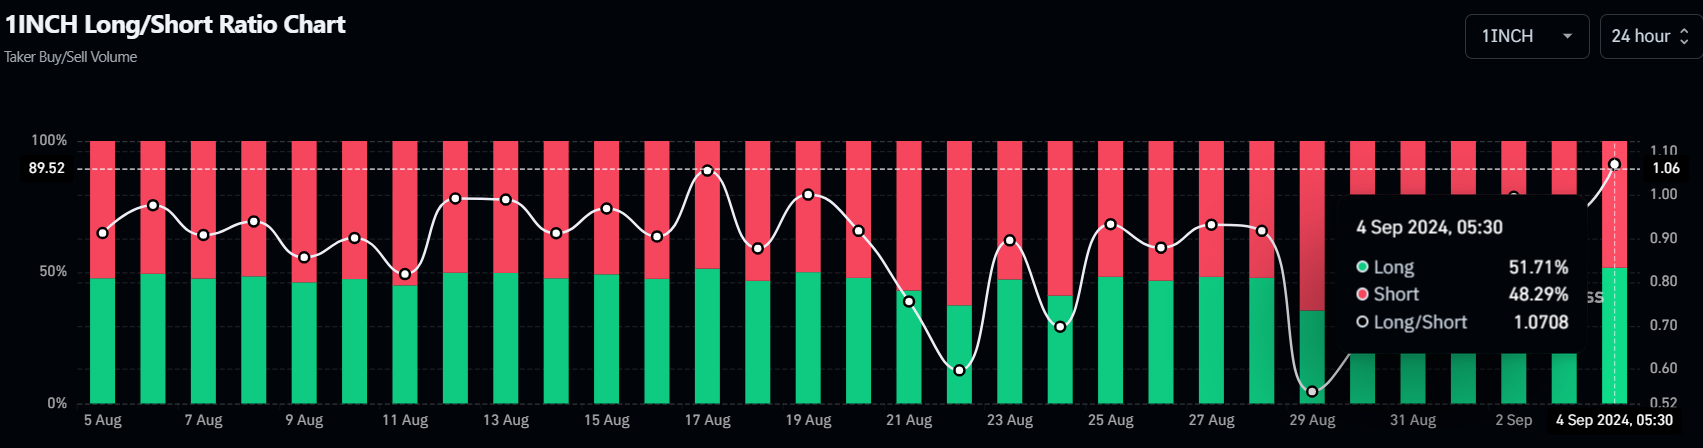
1INCH long-to-short ratio chart
Santiment’s Exchange Flow balance shows the net movement of tokens into and out of exchange wallets. A positive value indicates more tokens entered into the exchanges than exited, suggesting selling pressure from investors. Conversely, a negative value indicates more 1INCH left the exchange than entered, indicating less selling pressure from investors.
In 1inch’s case, the Exchange Flow balance slumped from 2.21 million to -8.47 million from Monday to Wednesday. This negative spike indicates increased confidence among investors. During the same period, 1INCH’s Supply on Exchanges declined by 2.26%. This is a bullish development, further denoting investor confidence in 1INCH.
%20[12.24.21,%2004%20Sep,%202024]-638610396967596082.png)
1INCH Exchange Flow Balance and Supply on Exchanges chart
Even though on-chain metrics and technical analysis support the bullish outlook, if 1INCH makes a daily candlestick close below $0.211, the bullish thesis would be invalidated by creating a lower low on the daily chart. This development could see 1inch’s price decline by 5% to retest August 17, 2023, low of $0.201.
Author

Manish Chhetri
FXStreet
Manish Chhetri is a crypto specialist with over four years of experience in the cryptocurrency industry.


