Top 3 Price Prediction Bitcoin, Ethereum, Ripple: Bitcoin continues its downtrend
- Bitcoin price approaches crucial support level at $56,000; a close below could see its downtrend persist.
- Ethereum price nears $2,300, with a break signaling a bearish trend ahead.
- Ripple price hovers 200-day EMA at $0.549; a firm close below would suggest a decline ahead.

Bitcoin (BTC) and Ripple (XRP) prices are approaching their key support levels; closing below suggests a decline ahead. At the same time, Ethereum (ETH) also trails Bitcoin’s path as it nears the $2,300 level, with a break below this level indicating a bearish trend ahead.
Bitcoin price is set for downward trend after closing below the $56,000 level
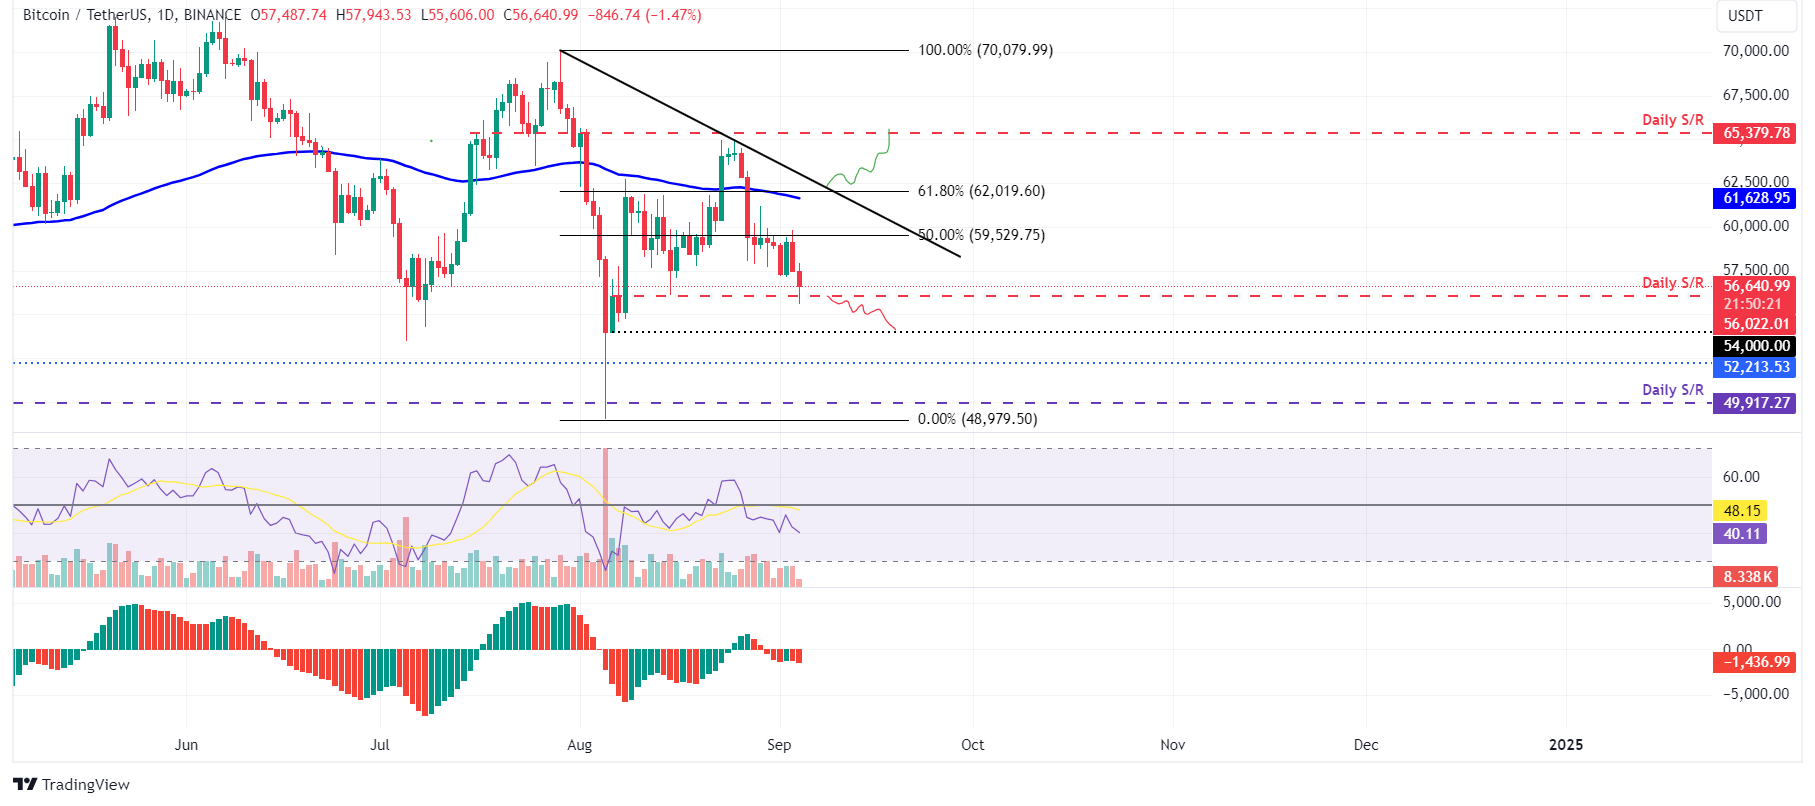
Bitcoin was rejected after retesting its 50% price retracement level at $59,560 (drawn from a high in late July to a low in early August) and dropped 2.78% on Tuesday. On Wednesday, it continued its downtrend, declining by 1.5% to $56,640 and retesting the daily support level at $56,022.
If BTC closes below the $56,022 support level, it could decline further by 3.5% to retest the $54,000 psychological level.
The Relative Strength Index (RSI) and the Awesome Oscillator (AO) on the daily chart trade below their respective neutral levels of 50 and zero, respectively. Both indicators suggest weak momentum and a continuation of its downward trend.
BTC/USDT daily chart
In an upside scenario, Bitcoin’s price could break above the $59,560 resistance and close above $62,019, the 61.8% Fibonacci retracement level. In that case, the bearish thesis will be invalidated, and BTC could extend the positive move by 5.5% to revisit its daily resistance level at $65,379.
Ethereum is poised for a downturn after closing below the $2,300 level
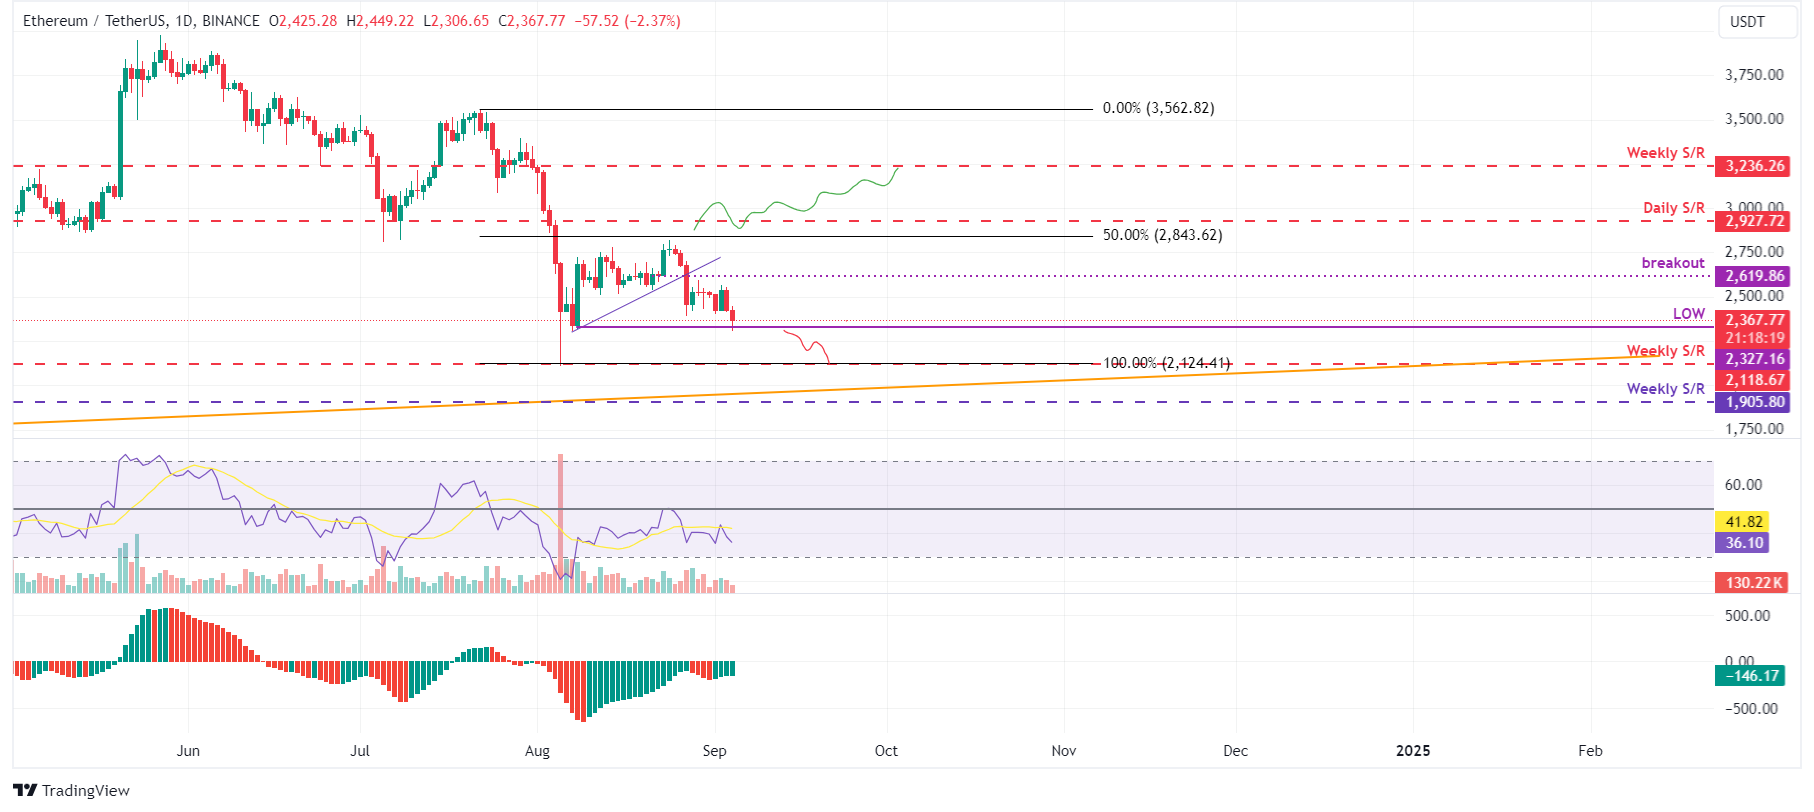
Ethereum price was rejected around its previously broken ascending trendline (formed by connecting multiple low levels from August 7) around $2,619, dropping 4.4% on Tuesday. As of Wednesday, it continues to decline by 2.5% at $2,367 and retests its August 8 low of $2,327.
If ETH closes below the $2,327 level, it could decline by 8.5% to retest its weekly support at $2,118.
The daily chart’s RSI and AO are trading below the neutral levels of 50 and zero. These momentum indicators strongly indicate bearish dominance.
ETH/USDT daily chart
On the other hand, if ETH breaks above the $2,619 level and closes above the daily resistance at $2,927, forming a higher high on the daily chart, this would invalidate the bearish thesis, and it could rally 11% to retest its weekly resistance level at $3,236.
Ripple price is set for a down leg after closing below key support level
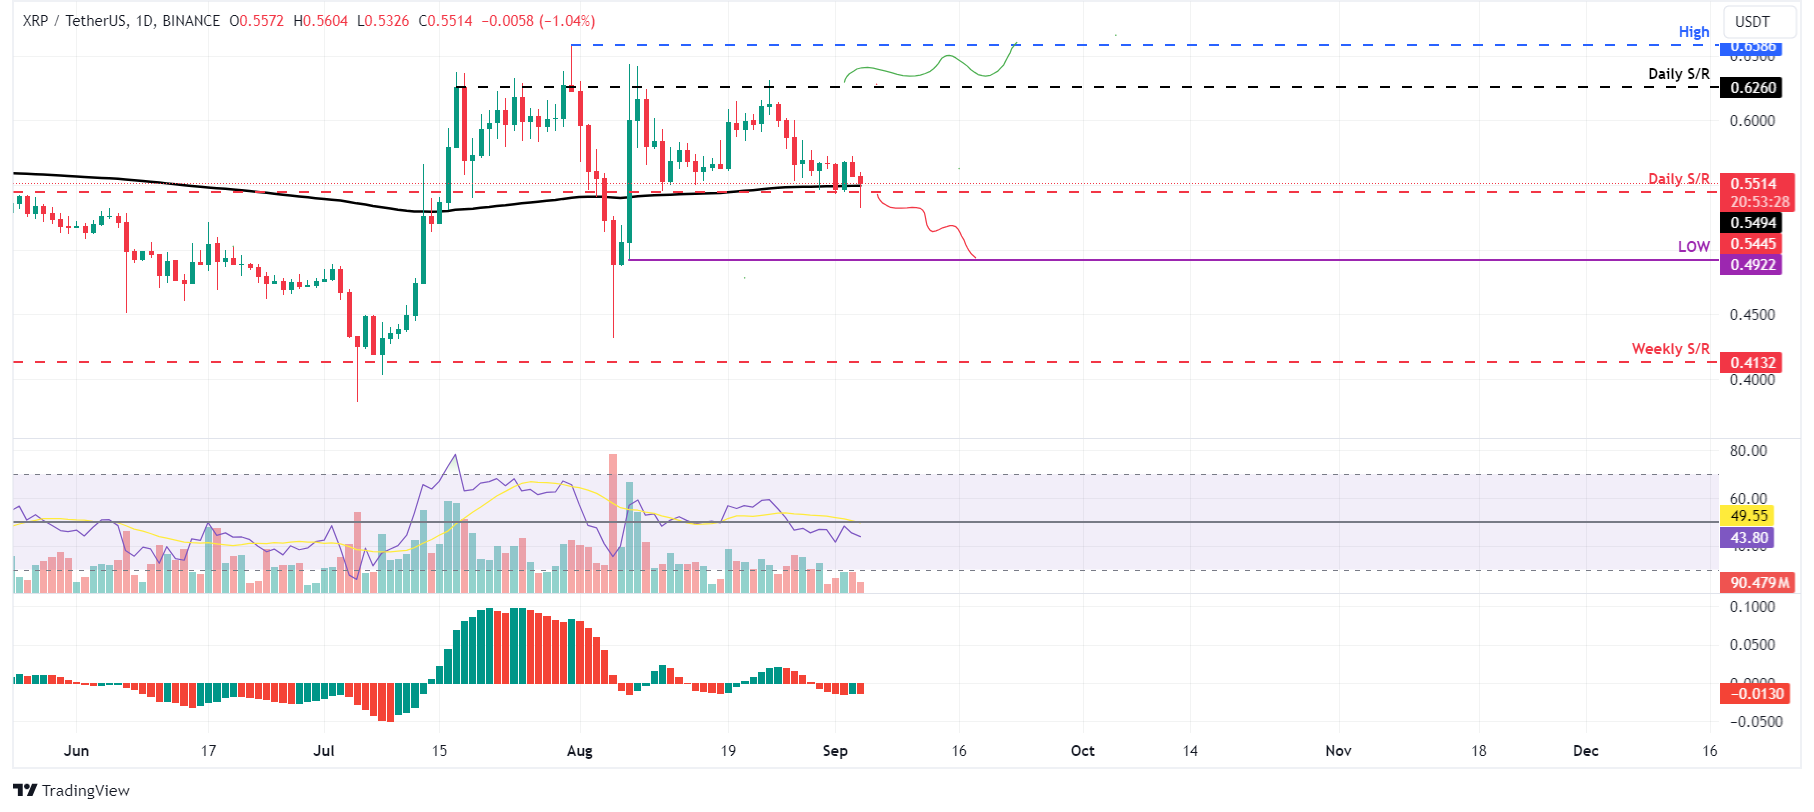
Ripple price is finding crucial support around the 200-day EMA at $0.549, coinciding with the daily support level at $0.544. Currently trading slightly lower by 1% at $0.551, if XRP breaks below these levels, it could drop by 10% to retest the August 7 low of $0.492.
The RSI and AO are trading below the neutral levels of 50 and zero on the daily chart. These momentum indicators signal a continuation of the bearish dominance and impending fall in prices on the horizon.
XRP/USDT daily chart
However, if the Ripple price closes above the $0.626 daily resistance level, it would shift the market structure by creating a higher high on the daily chart, potentially leading to a 5.3% rise to revisit the July 31 high of $0.658.
Cryptocurrency prices FAQs
Token launches like Arbitrum’s ARB airdrop and Optimism OP influence demand and adoption among market participants. Listings on crypto exchanges deepen the liquidity for an asset and add new participants to an asset’s network. This is typically bullish for a digital asset.
A hack is an event in which an attacker captures a large volume of the asset from a DeFi bridge or hot wallet of an exchange or any other crypto platform via exploits, bugs or other methods. The exploiter then transfers these tokens out of the exchange platforms to ultimately sell or swap the assets for other cryptocurrencies or stablecoins. Such events often involve an en masse panic triggering a sell-off in the affected assets.
Macroeconomic events like the US Federal Reserve’s decision on interest rates influence risk assets like Bitcoin, mainly through the direct impact they have on the US Dollar. An increase in interest rate typically negatively influences Bitcoin and altcoin prices, and vice versa. If the US Dollar index declines, risk assets and associated leverage for trading gets cheaper, in turn driving crypto prices higher.
Halvings are typically considered bullish events as they slash the block reward in half for miners, constricting the supply of the asset. At consistent demand if the supply reduces, the asset’s price climbs. This has been observed in Bitcoin and Litecoin.
Author

Manish Chhetri
FXStreet
Manish Chhetri is a crypto specialist with over four years of experience in the cryptocurrency industry.



