1INCH price faces downturn after rejection at key resistance, negative on-chain metrics
- 1inch price faced rejection from a descending trendline and closed below the 200-day EMA around $0.311 on Saturday, hinting at a downward move.
- On-chain data paints a bearish picture as 1INCH’s Exchange Flow balance spikes upward and dormant wallets are in motion.
- A daily candlestick close above $0.322 would invalidate the bearish thesis.
1inch (1INCH) extends losses on Monday after being rejected from its key resistance level on Saturday. On-chain data further support the bearish outlook, as 1INCH’s Exchange Flow Balance is positive, and dormant wallets are in motion, suggesting a decline in the upcoming days.
1inch price set for a downturn after rejection from its resistance barrier
1inch’s price failed to close above a descending trendline (drawn by connecting multiple high levels since March) on Saturday, declining by 4.2% until Sunday. This descending trendline roughly coincides with the 200-day Exponential Moving Average (EMA) at $0.311 and the daily resistance level at $0.322, making it a key resistance zone. On Monday, it continues to trade down around $0.285 at the time of writing, extending losses by over 4% in the day.
If bearish momentum persists and 1INCH closes below the $0.283 level, it could extend the decline by 18% to retest its September 18 low of $0.233.
The Relative Strength Index (RSI) on the daily chart tilts lower at 53, reflecting the decrease in bullish momentum. If it continues to trade down and closes below its neutral level of 50, it will give a clear selling signal and strong bearish momentum.
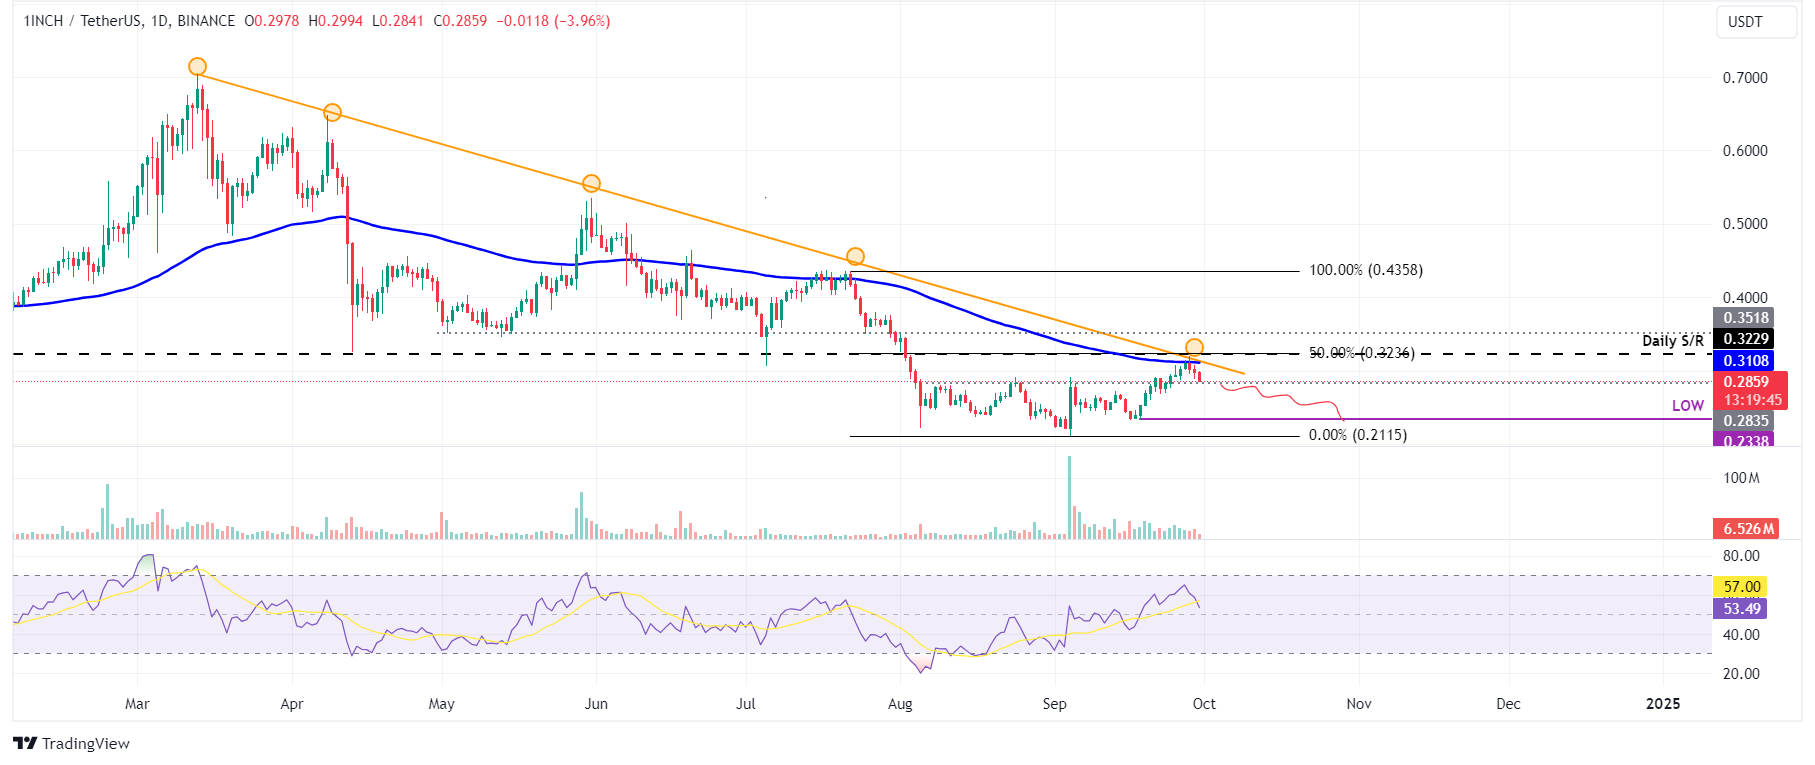
1INCH/USDT daily chart
Santiment’s Exchange Flow Balance index aligns with the bearish outlook. This metric shows the number of 1INCH tokens getting into and out of the exchanges. A rise in this metric suggests that more tokens are moving into the exchange, indicating increasing selling pressure from investors as they are willing to sell. Conversely, a fall in this metric indicates more tokens are leaving the exchange and moving to cold wallets, suggesting decreasing selling pressure.
As in 1INCH’s case, the metric spiked from -407,910 on September 24 to 44.01 million on September 25. This increase suggests that investors are moving 1INCH tokens into the exchange, leading to a 6% rise in exchange supply, hence increasing the selling pressure.
%20[12.55.07,%2030%20Sep,%202024]-638632896822404086.png)
1INCH Exchange Flow Balance and Supply on Exchanges Chart
Moreover, Santiment’s Age Consumed index is in line with the bearish outlook noted from a technical perspective. The spikes in this index suggest dormant tokens (tokens stored in wallets for a long time) are in motion and can be used to spot short-term local tops or bottoms.
In 1INCH’s case, history shows that the spikes were followed by a decline in 1INCH price. The most recent uptick on September 25 also signals that 1INCH is ready for a downtrend.
%20[12.56.29,%2030%20Sep,%202024]-638632897679012164.png)
1INCH Age Consumed index chart
Even though on-chain metrics and technical analysis support the bearish outlook, if 1INCH makes a daily candlestick close above $0.322, the bearish thesis would be invalidated by creating a higher high on the daily chart. This development could see 1inch’s price rise by 9% to retest the next daily resistance level at $0.351.
Author

Manish Chhetri
FXStreet
Manish Chhetri is a crypto specialist with over four years of experience in the cryptocurrency industry.


