Top dog-theme meme coins WIF, BONK, FLOKI: Double-digit gains on the horizon
- Dogwifhat, Bonk and FLOKI registered gains of more than 20% last week.
- The three dog theme-based meme coins hover around key levels, signaling the possibility of further gains ahead.
- The RSI nears overbought levels for WIF, BONK and FLOKI, increasing the odds of a corrective pullback.

The prices of top trending dog-theme-based meme coins, Dogwifhat (WIF), Bonk (BONK) and FLOKI (FLOKI), hold gains on Monday after prices increased more than 20% last week. The technical outlook suggests that the bulls still have steam to push these three meme coins for extra double-digit gains.
Dogwifhat bulls remain strong
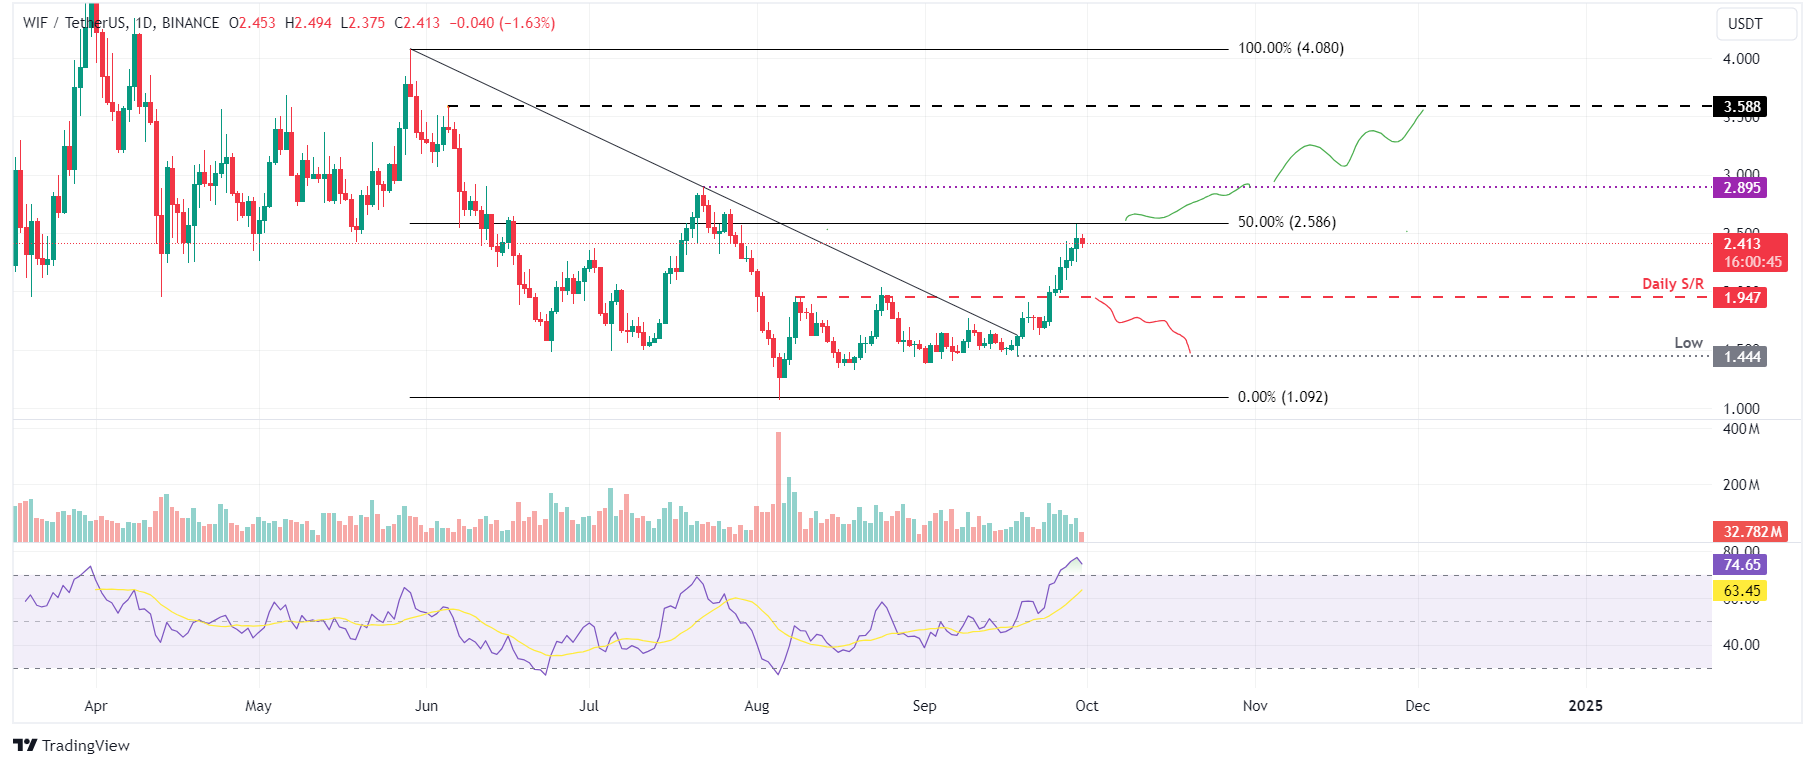
Dogwifhat price broke above the descending trendline and closed above the daily resistance level at $1.947 on September 24, rallying 23% over the next four days. On Monday, it trades slightly down, around $2.413.
If WIF closes above its 50% price retracement at $2.586, it could extend its rally by 12% to retest the July 22 high of $2.895.
The Relative Strength Index (RSI) stands at 74, trading above its overbought level of 70. Traders should be cautious because the chances of a price pullback are increasing, particularly as the RSI tilts down. If it exits overbought territory, it would give a clear selling signal. Another possibility is that the rally continues, and the RSI remains above the overbought level.
WIF/USDT daily chart
On the other hand, if WIF fails to close below its 50% price retracement at $2.586 and declines down, closing below the daily support at $1.947. This price action could extend the decline to retest the September 18 low of $1.444.
Bonk price shows potential for a rally
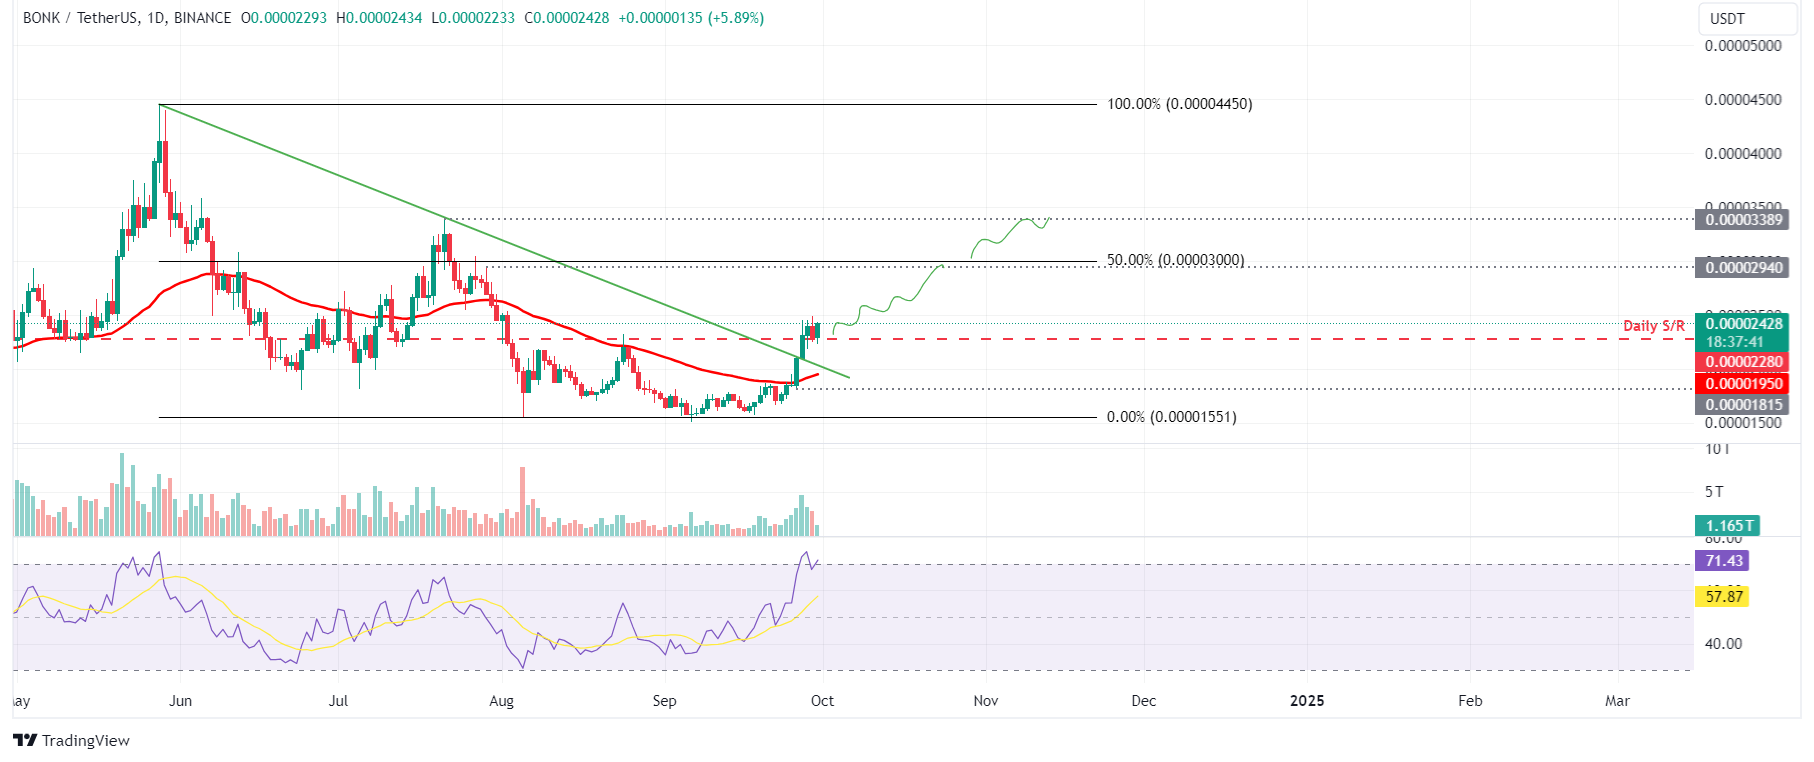
Bonk price broke above the descending trendline (drawn from the end of May to the end of September) on Friday and rallied 15% to close above the daily resistance level at $0.0000228. On Monday, it trades slightly higher at around $0.0000242.
If the $0.0000228 holds as support, BONK could rally 19% from its current trading level to retest its 50% price retracement level at $0.000030 (drawn from May high to August low).
The RSI has bounced back, trading above the overbought level of 70 and pointing upwards, suggesting that bulls still have a stem for the upward rally. However, traders should note that the RSI at these levels increases the chances of a price pullback.
BONK/USDT daily chart
If BONK closes below $0.0000228, it could extend the decline to retest its September 17 low of $0.0000181.
FLOKI price looks promising
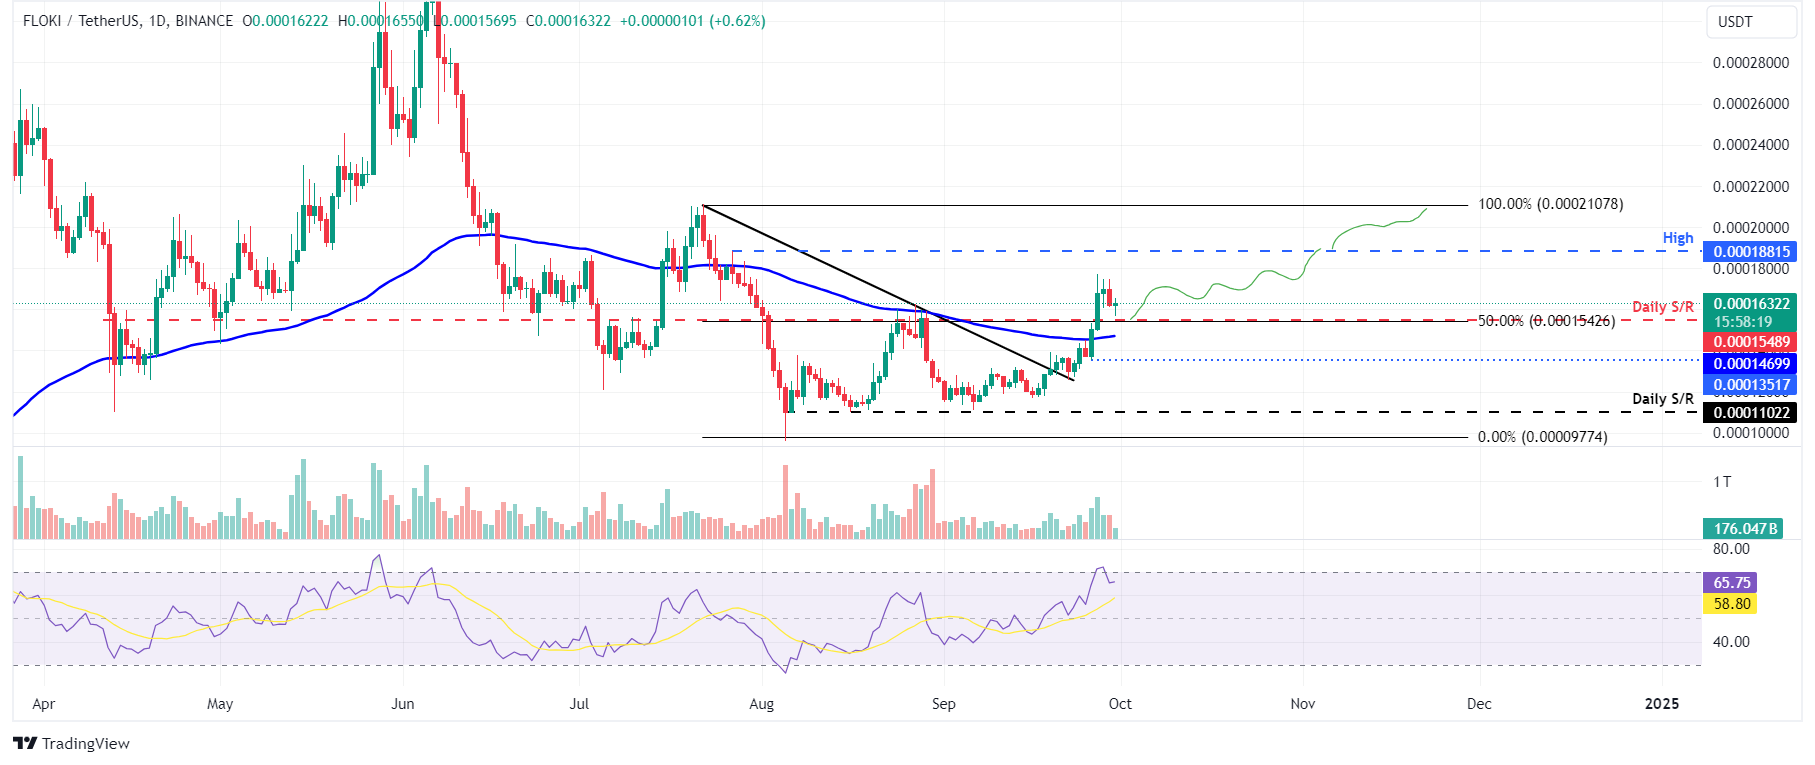
FLOKI's price broke on Friday above its daily resistance level at $0.000154, which coincides with the 50% price retracement level, and rallied 12.5%. On Monday, it trades slightly above, its $0.000154 key support level.
If the $0.000154 support level holds, FLOKI could rally 21% to retest its July 27 high of $0.000188.
The RSI is trading down from its overbought level of 70, suggesting a decrease in bullish momentum. Still, the momentum indicator stays broadly stable at 66, suggesting bulls remain strong.
FLOKI/USDT daily chart
Conversely, if FLOKI closes below the $0.000154 support level, it could extend the decline to retest its September 26 low of $0.000135.
Author

Manish Chhetri
FXStreet
Manish Chhetri is a crypto specialist with over four years of experience in the cryptocurrency industry.




