Weekly waves: EUR/USD, GBP/USD, and Bitcoin
-
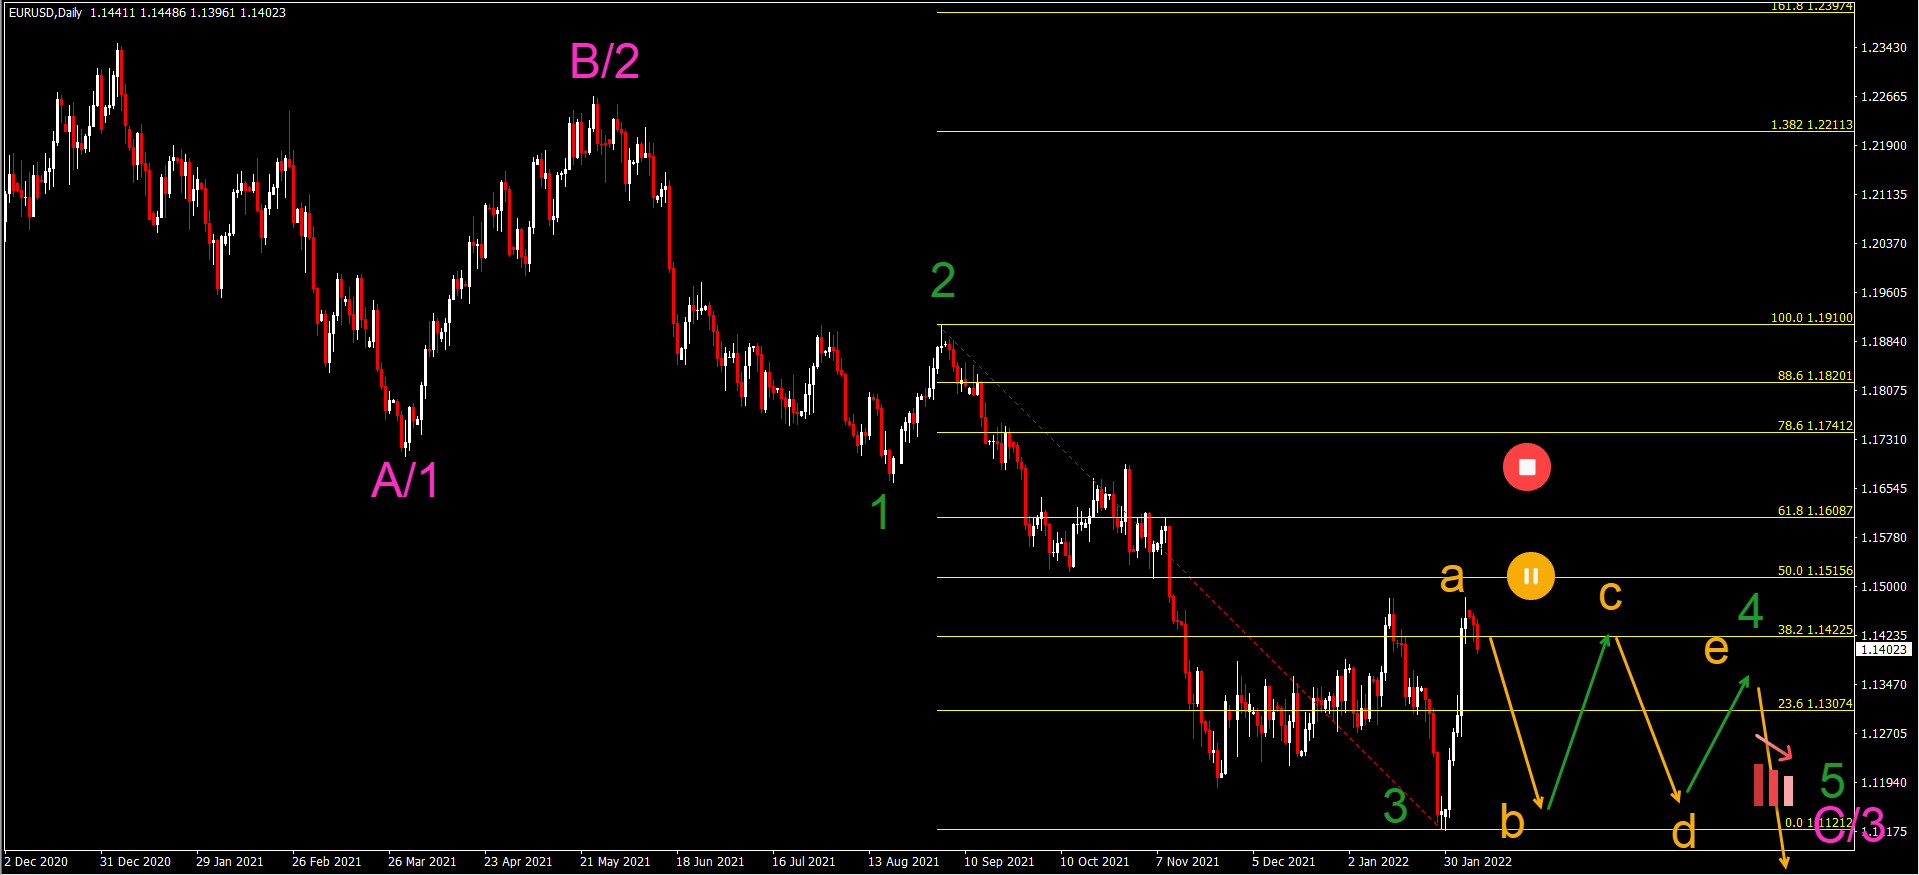
Is it time for a bullish reversal on the EURUSD? Not yet in our analysis. Price action made a strong move up but has respected the 38.2%-50% Fibonacci resistance levels.
-
At the moment, price action is making a 3 wave pattern upwards - like an ABC or 123 (green). But the 3rd wave is much stronger than the usual wave C.
-
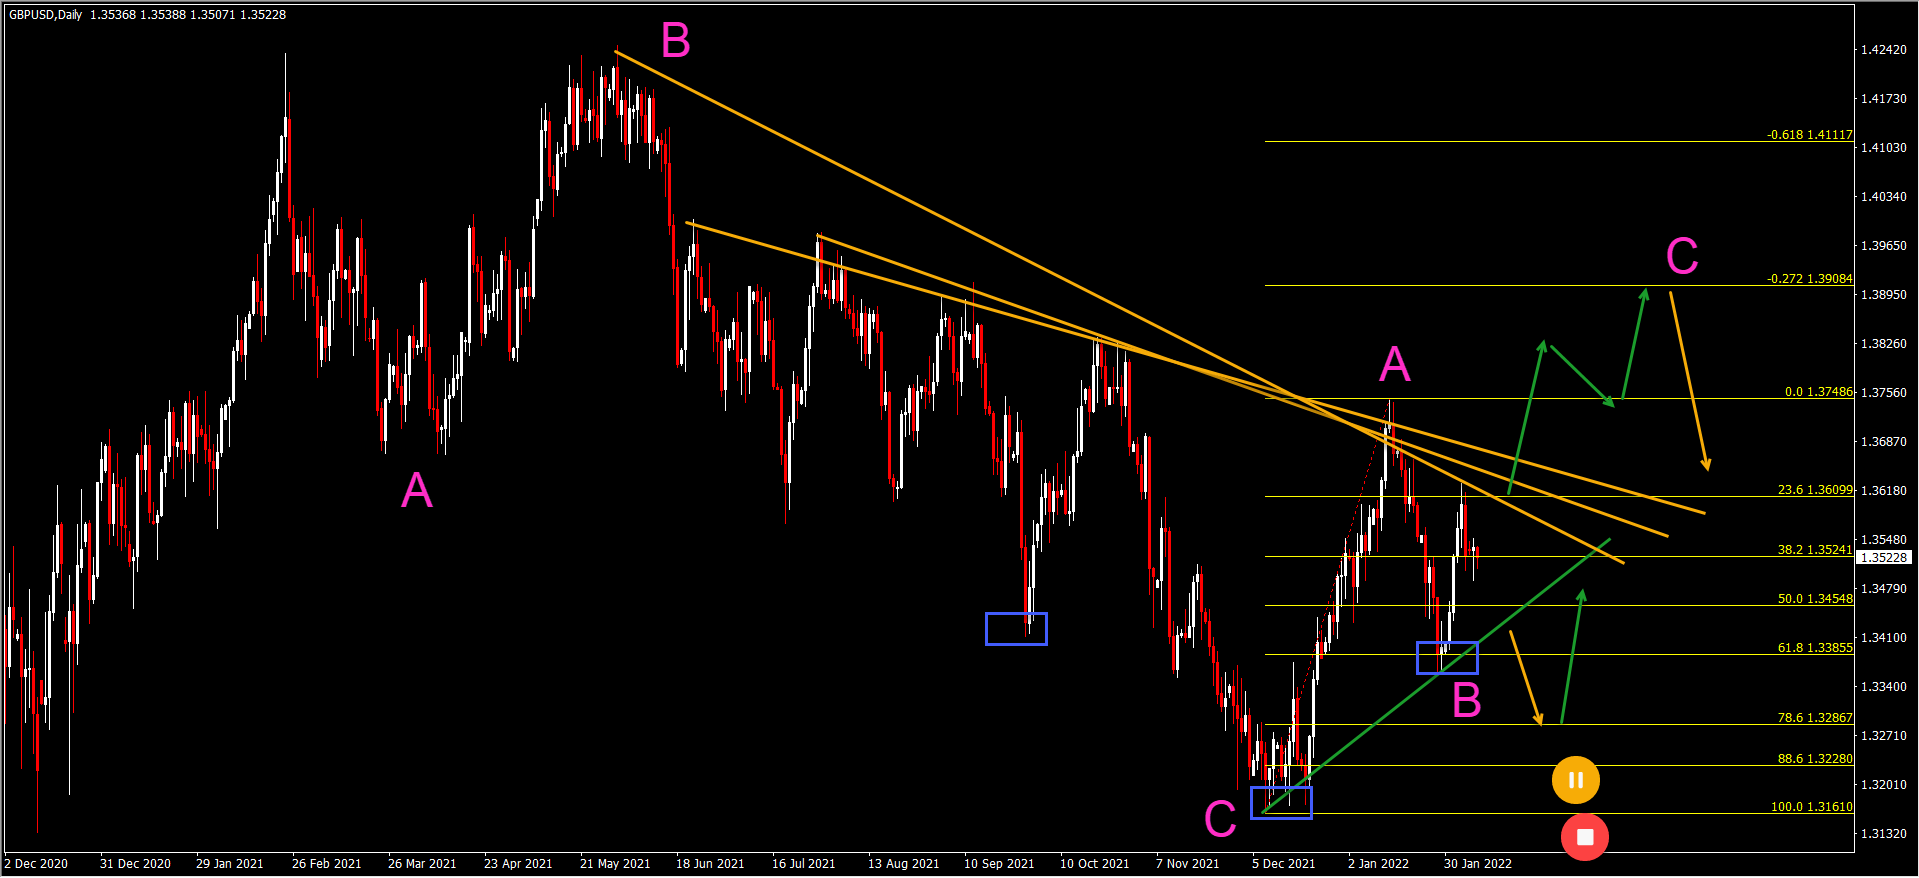
The GBP/USD daily chart made a bullish bounce at the 61.8% Fibonacci retracement level and inverted head and shoulders pattern (blue boxes) our weekly Elliott Wave analysis reviews the EUR/USD, the Bitcoin cryptocurrency, and the GBP/USD.

EUR/USD bullis spike part of triangle pattern?
The EUR/USD looked bearish in last week’s Elliott Wave analysis but price action actually made a very strong bullish bounce.
-
Is it time for a bullish reversal? Not yet in our analysis. Price action made a strong move up but has respected the 38.2%-50% Fibonacci resistance levels.
-
The bullish swing is expected to be a wave A (orange) of a larger ABCDE (orange) triangle pattern. The triangle would confirm the wave 4 (green) pattern.
-
A bearish breakout would indicate a wave 5 (green) of wave 3 (pink) whereas a bullish breakout above the top places the bearish analysis on hold. A break above the bottom of wave 1 (red circle) invalidates it. The main target for the bearish trend is 1.10.
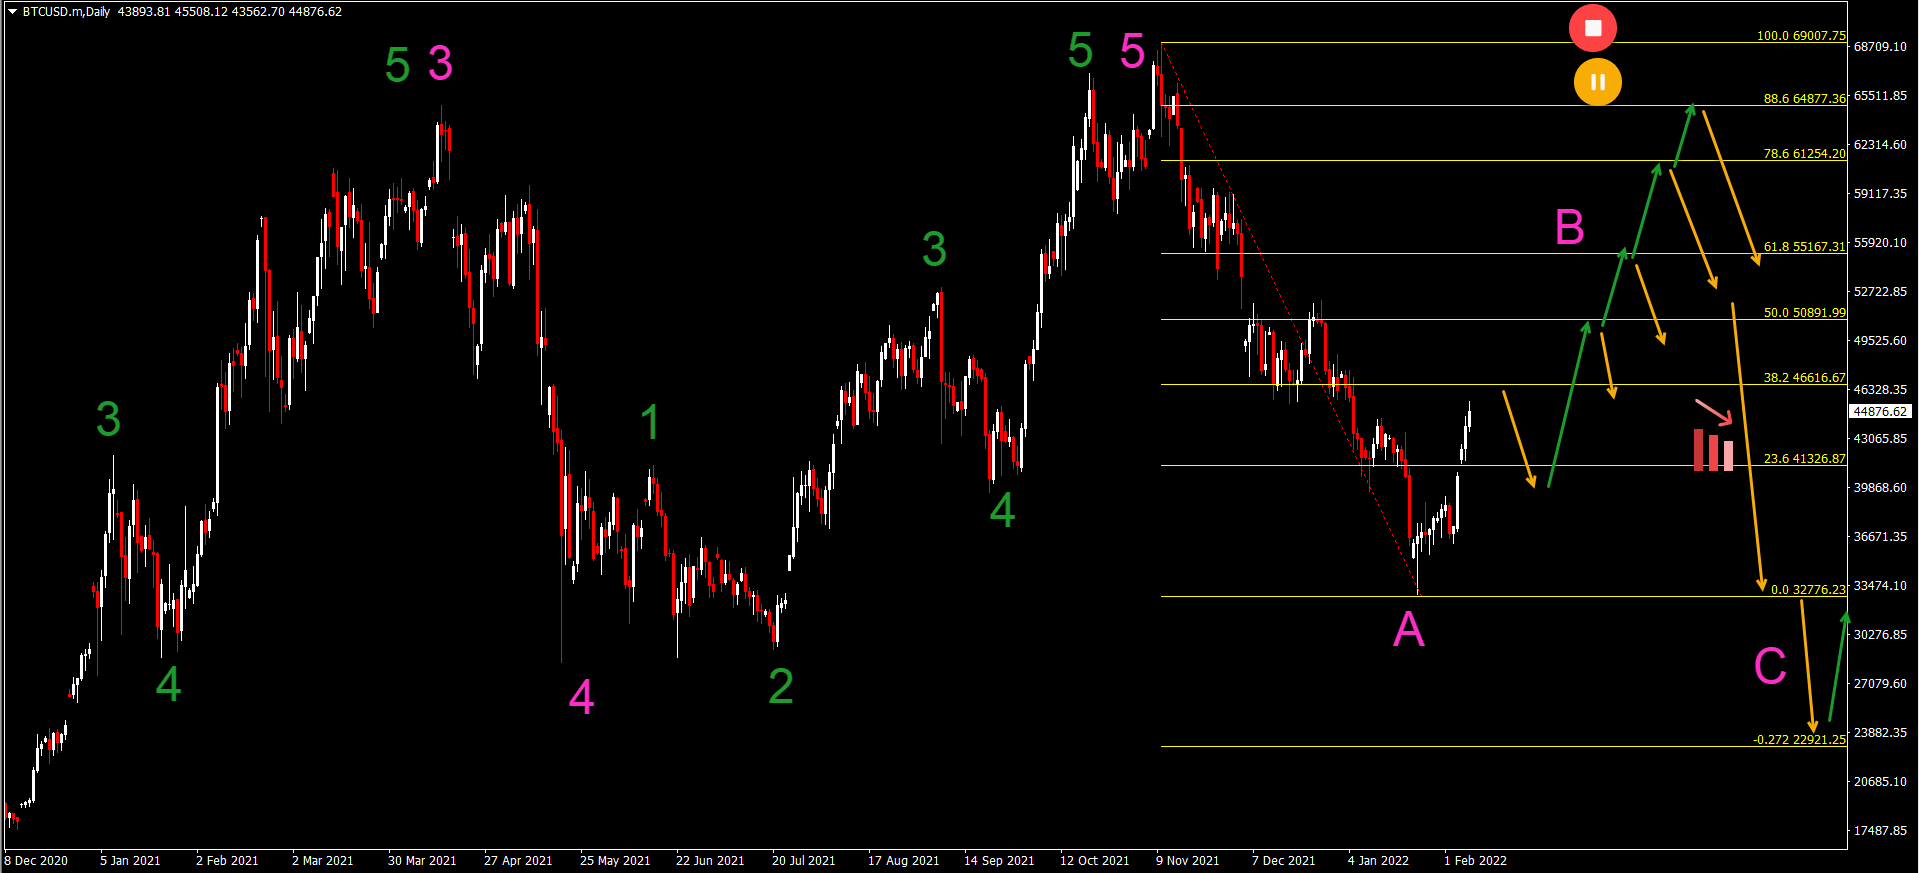
BTC/USD re-changes back to original ABC pattern
The Bitcoin crypto pair (BTC/USD) seemed to have completed a bearish wave A at the end of January. Last week we decided to make a revision to that Elliott Wave forecast with a wave 4 and then another bearish wave 5. Now the situation is 50-50%:
-
At the moment, price action is making a 3 wave pattern upwards - like an ABC or 123 (green). But the 3rd wave is much stronger than the usual wave C and is behaving more like wave 3.
-
If price action completes a 5 wave pattern on lower time frames, then the bearish scenario with a wave 4-5 within wave A (pink) is unlikely.
-
In that case, a bullish ABC (gray) pattern is taking place within the expected wave B (pink).
-
Any of the Fibonacci retracement levels of wave B (pink) could stop price action from further gains and revert the price action back into wave C (pink).
-
A deep bullish push indicates that the previous bottom will probably be the final spot for wave C (pink) whereas a shallow bearish bounce at the 50 or 61.8% Fibonacci level indicates a potential deeper bearish wave C (pink) swing.
GBP/USD bullish ABC zigzag pattern
-
This remains valid as long as price action stays above the bottom (red circle).
-
A break below the 88.6% Fibonacci places the bullish zigzag pattern on hold (orange circle).
-
The main target is the -27.2% Fibonacci level at 1.39.
-
A break above the resistance trend lines (orange) confirms the potential bullish breakout.
-
A break below the support trend line (green) indicates a test of deeper Fibonacci retracement levels.
The analysis has been done with the indicators and template from the SWAT method simple wave analysis and trading. For more daily technical and wave analysis and updates, sign-up to our newsletter.
Author

Chris Svorcik
FS method
Chris Svorcik is a trader, analyst, and educator with over 15 years of experience in financial markets, specializing in moving averages, market structure, and price patterns.


