US Dollar Index, gold, silver: A confluence of signs this week

With silver outperforming and key supports for the USDX holding, what’s in store for the precious metals in the upcoming months?
Yesterday’s session was informative. Very. I already indicated some of the specific developments during yesterday’s (pre-market) trading (and I talked about silver and bitcoin recently as well), but having the closing prices, and knowing what happened on a day-to-day basis adds a new dimension to the signals that we saw.
Let’s jump into charts.
What was so important about yesterday?
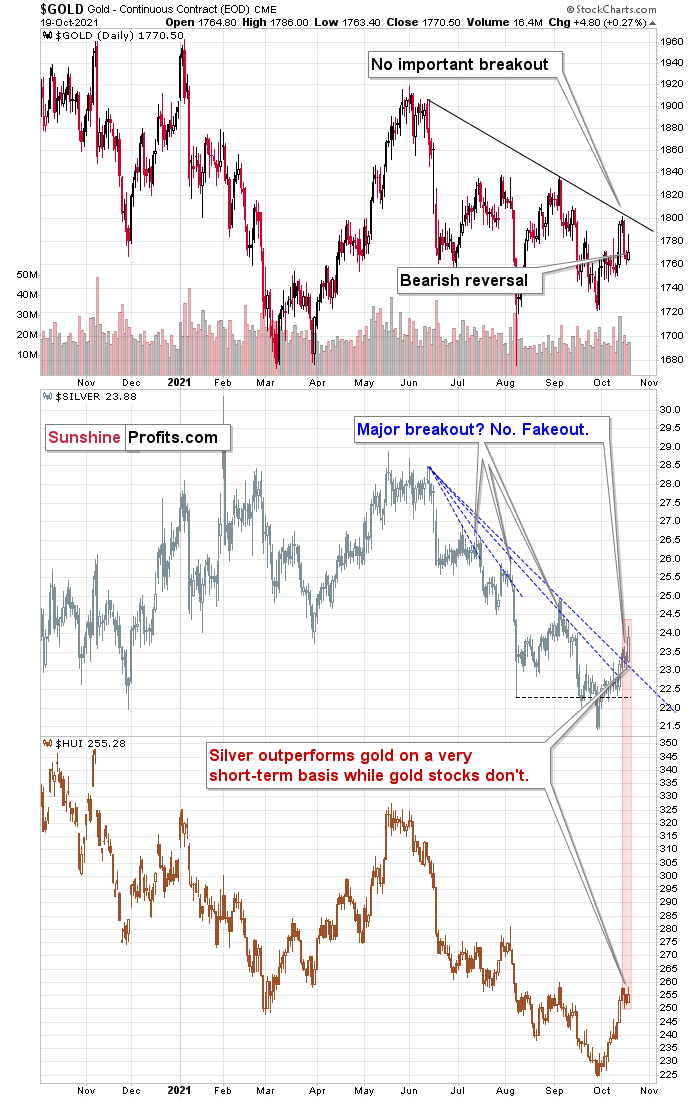
The key thing that happened yesterday was that silver rallied profoundly while gold stocks didn’t. The latter moved just a little higher, just like gold. This tells us that the rally has most likely either run its course completely or that its end is just around the corner. I’ve been emphasizing this many times before, but it’s so important (and so ignored) that I’m going to repeat it once again – silver tends to outperform in the final part of a rally in the precious metals market. This – by itself – is one of key indications that a top is just around the corner or that we have already seen one.
Yesterday’s daily reversal in gold only adds to the bearish implications of the session. Despite the attempt to move much higher, gold ended the day a mere $4.80 higher.
The key development, though, happened not in the precious metals market, but in the USD Index. Namely, the USD Index managed not to close back below the previous 2021 highs in terms of the closing prices.
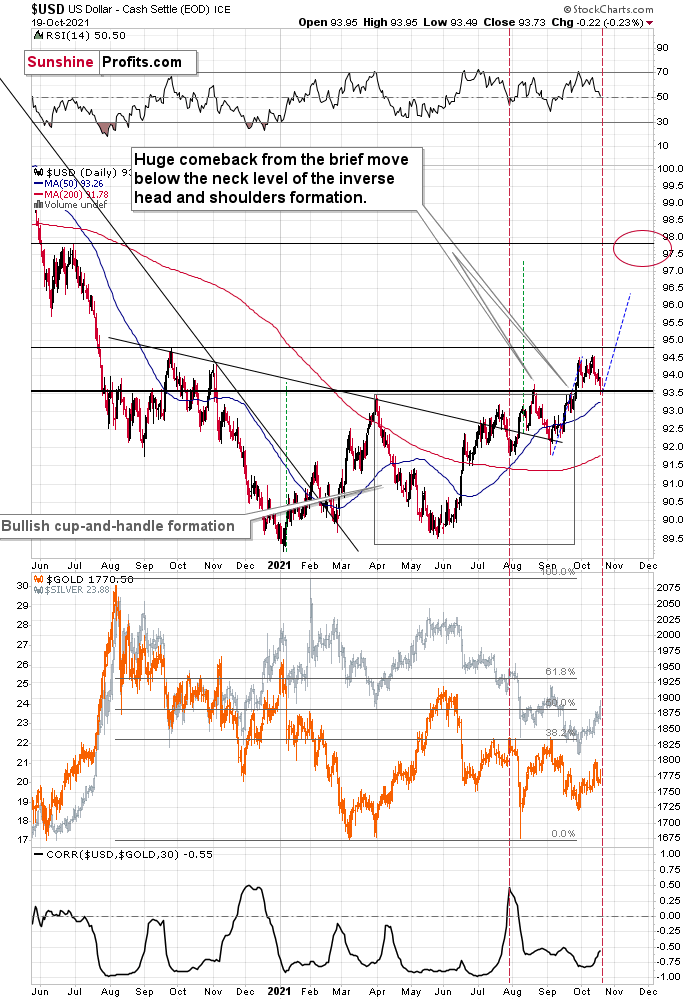
The U.S. currency did end the day lower, but it was after a recovery from a much bigger intraday decline. The August top in terms of the daily closing prices is 93.59, and while yesterday’s intraday lows was 93.49, the USDX closed the day at 93.73. The key support held and – obviously – that’s a bullish development for the USDX. Since the latter tends to move in the opposite way to the gold price and silver price, we can say that the above is bearish for the precious metals sector.
The lower part of the above charts shows the correlation between the USDX and gold (based on the previous 30 trading days) and as you can see, the correlation is almost always negative, and usually strongly negative – below -0.5.
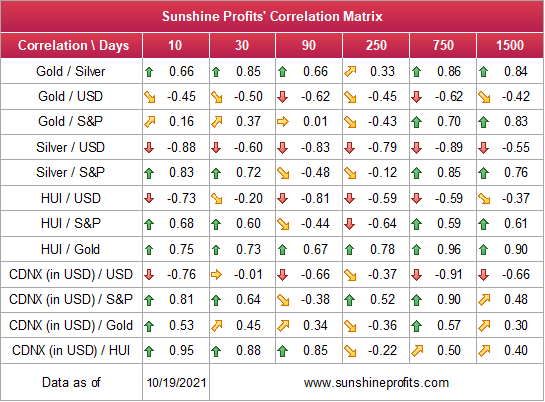
As you can see in the above Correlation Matrix (second row from the top), gold is negatively correlated with the USD Index also in the medium term and in the long term, so this link is quite stable, even though there are exceptions (for example, at times gold shows strength despite the USD’s rallies and it indicates great buying opportunities for gold).
The correlation now moved higher, but please note that we saw something similar (to an even bigger extent) in late July, and that was when gold and the USDX itself were performing similarly to what we saw recently. Even the RSI indicator (upper part of the chart) was close to 50 in both cases.
Gold and silver are slightly up in today’s pre-market trading, but it doesn’t change any of the above. The USD Index is still above the highest daily close that we saw in August.
Consequently, while yesterday’s session might have appeared to be something major, it turned out to be just a combination of factors that we saw at the final days of short-term rallies many times before. It seems that the medium-term downtrend will resume any day now.
Want free follow-ups to the above article and details not available to 99%+ investors? Sign up to our free newsletter today!
Want free follow-ups to the above article and details not available to 99%+ investors? Sign up to our free newsletter today!
Author

Przemyslaw Radomski, CFA
Gold Price Forecast
Przemyslaw Radomski, CFA (PR) is a precious metals investor and analyst who takes advantage of the emotionality on the markets, and invites you to do the same. His company, Sunshine Profits, publishes analytical software that any