![]() Tomasz Wisniewski
Tomasz Wisniewski
Axiory Global Ltd.
Last time we analysed the USDCAD, we anticipated that this pair will go south. It was at the beginning of the December and the pair was around 1.3280. After that, we had almost 7 bearish days and the price indeed declined 150 pips. They reached the lower line of the flag and then decided to correct recent drop and went higher. Upswing stopped exactly on the previous highs and in the same time: 50% Fibonacci. That was the last stronghold for the sellers ad they used that wisely.
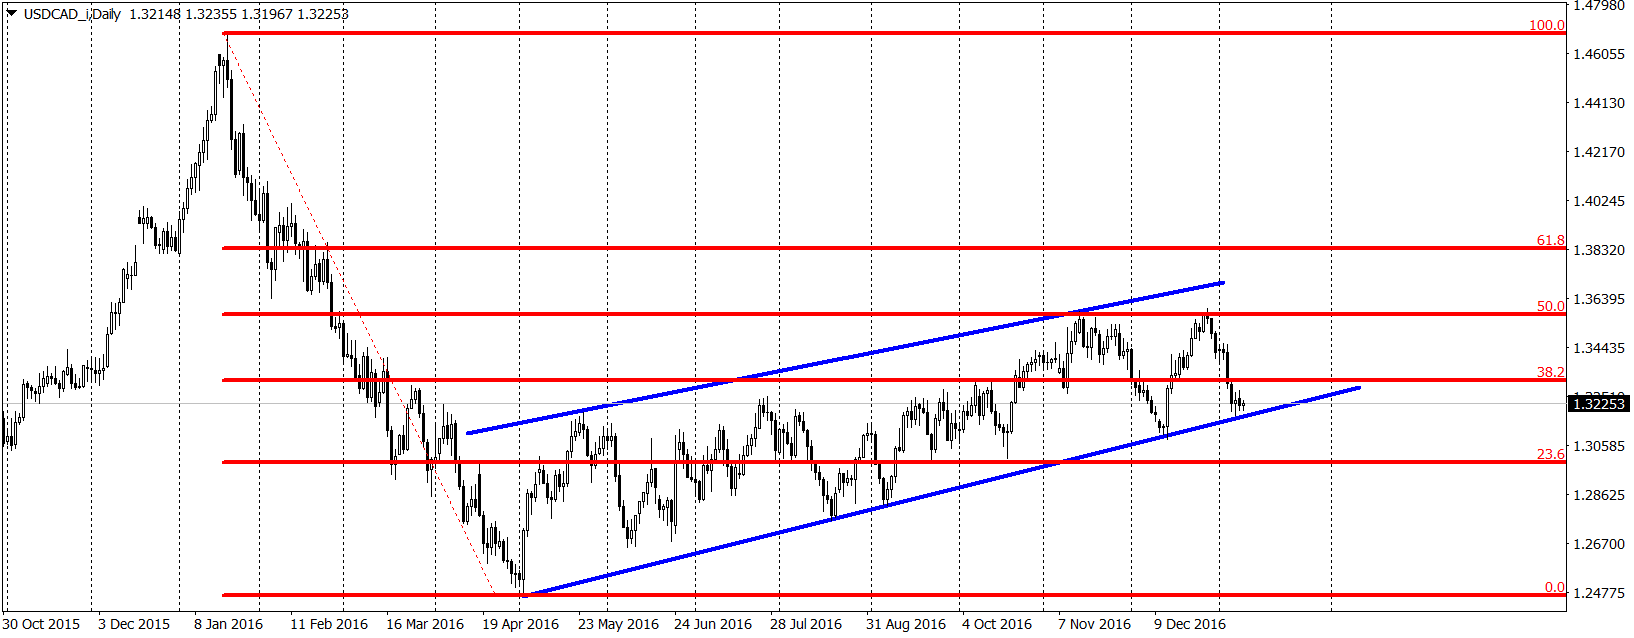
Price went down again and is now testing the lower line of the flag for the 4th time in the last few months. So far we do not see a bounce and the price is consolidating above the support. This is usually a negative sign and increases the odds for a breakout especially when we we will check all the previous bounces, which started almost immediately when price touched the lower line of this formation.
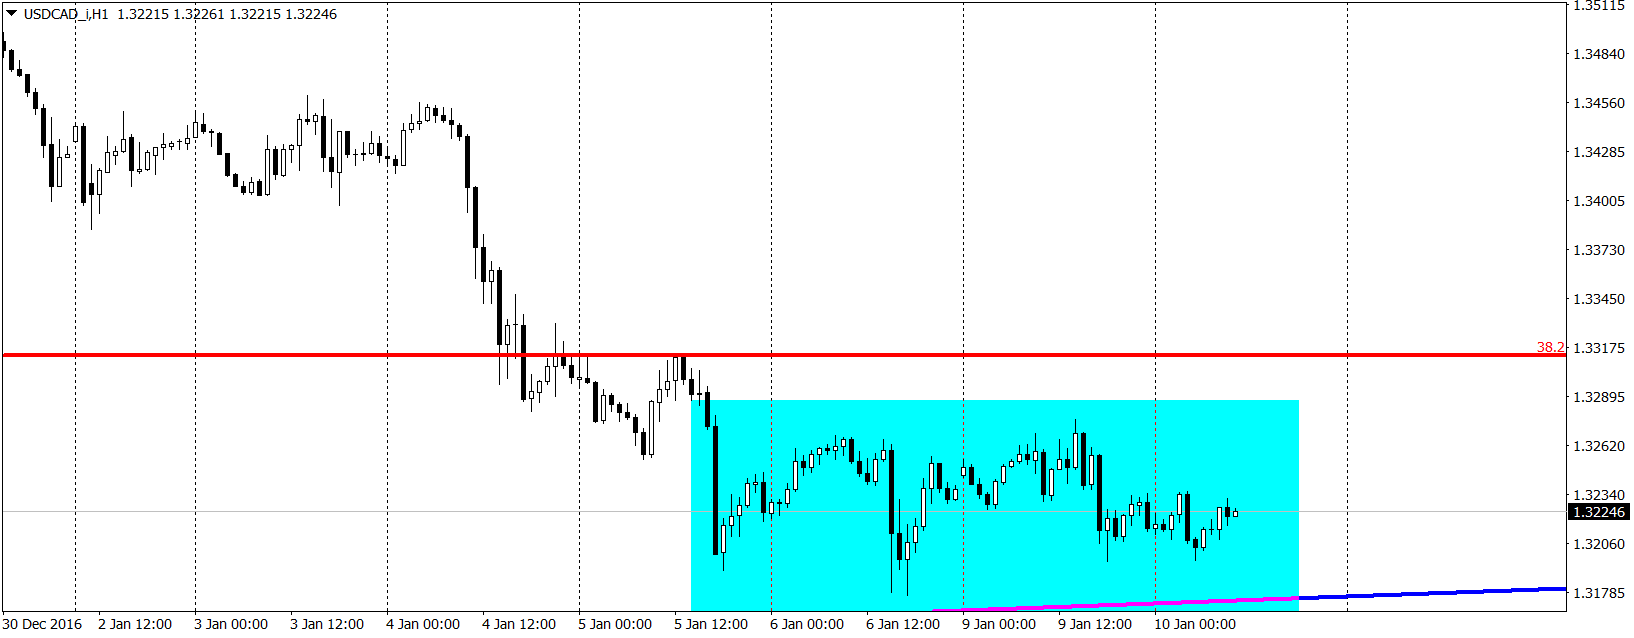
Looking on this pair in the short term can be useful, on the hourly chart we can see that traders attempted to create an inverted head and shoulder formation but they couldn't finish that with an upswing yesterday straight away after they created a right shoulder. Price went lower and now it looks more like a rectangle (blue area), which is a trend continuation pattern and we all know what is the trend right now.
Putting all that together give us a negative outlook on this instrument but sell signal is not yet created here. What we are missing is the breakout of the lower line of the flag. Once the price will be able to break this support, sell signal will be active.
Trading FX/CFDs on margin bears a high level of risk, and may not be suitable for all investors. Before deciding to trade FX/CFDs you should carefully consider your investment objectives, level of experience, and risk appetite. You can sustain significant loss.
Recommended Content
Editors’ Picks
EUR/USD holds below 1.0750 ahead of key US data

EUR/USD trades in a tight range below 1.0750 in the European session on Friday. The US Dollar struggles to gather strength ahead of key PCE Price Index data, the Fed's preferred gauge of inflation, and helps the pair hold its ground.
USD/JPY stays firm above 156.00 after BoJ Governor Ueda's comments

USD/JPY stays firm above 156.00 after surging above this level on the Bank of Japan's decision to leave the policy settings unchanged. BoJ Governor said weak Yen was not impacting prices but added that they will watch FX developments closely.
Gold price oscillates in a range as the focus remains glued to the US PCE Price Index

Gold price struggles to attract any meaningful buyers amid the emergence of fresh USD buying. Bets that the Fed will keep rates higher for longer amid sticky inflation help revive the USD demand.
Bitcoin Weekly Forecast: BTC’s next breakout could propel it to $80,000 Premium

Bitcoin’s recent price consolidation could be nearing its end as technical indicators and on-chain metrics suggest a potential upward breakout. However, this move would not be straightforward and could punish impatient investors.
US core PCE inflation set to signal firm price pressures as markets delay Federal Reserve rate cut bets

The core PCE Price Index, which excludes volatile food and energy prices, is seen as the more influential measure of inflation in terms of Fed positioning. The index is forecast to rise 0.3% on a monthly basis in March, matching February’s increase.