USD/JPY Forecast: Is the pair charting a long-term bullish inverse head-and-shoulders?
- The bull pennant breakout seen in the weekly chart signals continuation or revival of the rally from the 2011 low of 75.56.
- The breakout has opened doors to completion/creation of inverse head-and-shoulders pattern with neckline of 126.40.

The USD/JPY’s break above a key falling trend line hurdle has likely opened the doors to completion of a long-term inverse head-and-shoulders pattern.
Weekly chart: Trendline breached?
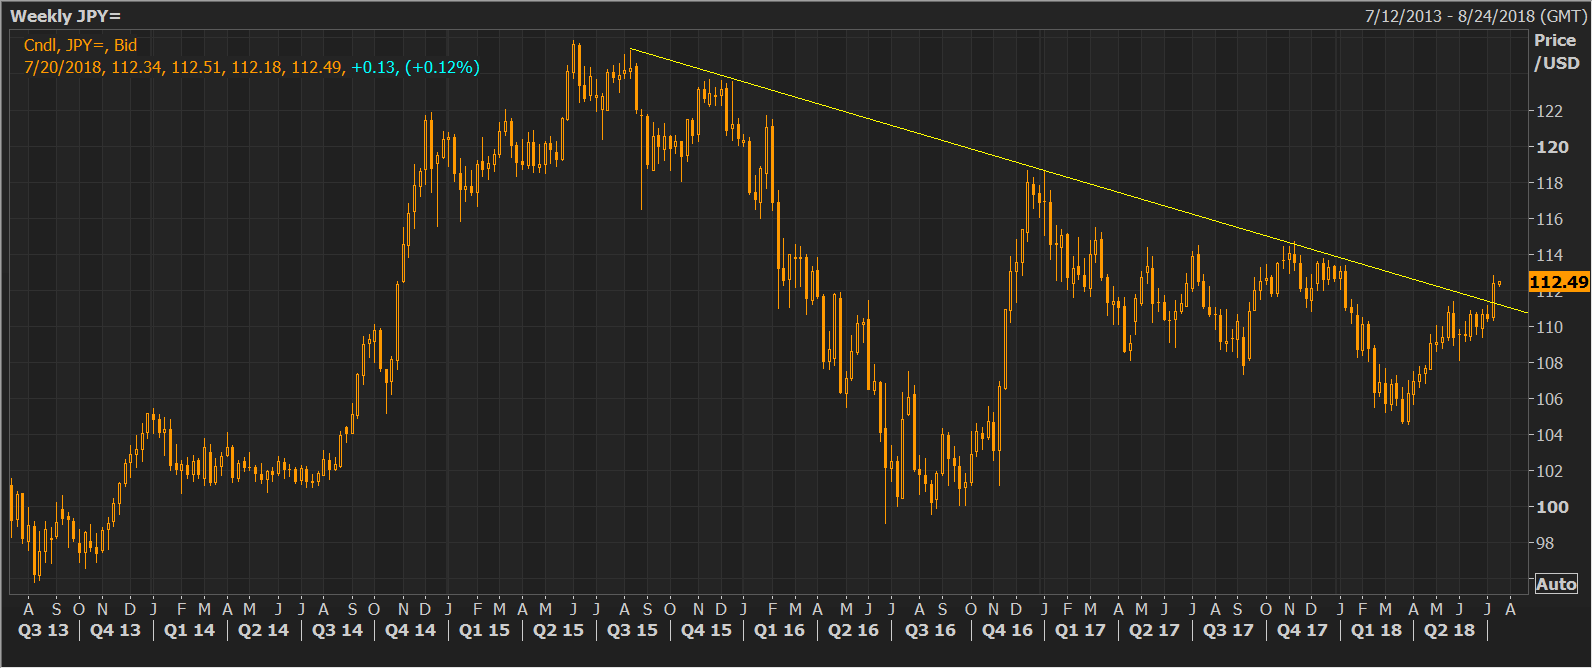
The above chart shows the currency pair cleared the three-year-long (2015-2018) falling trendline last week and closed well above 112.00, confirming the sell-off from the June 2015 high of 125.86 has ended and the bulls are back in a commanding position.
What’s more, the 5-week and 10-week moving average is biased to the bulls, the 14-week relative strength index (RS) is holding above 50.00 (in bullish territory).
Clearly, the odds are stacked in favor of a rally to/above the 200-week MA located at 113.24.
Weekly chart: Pennant breakout
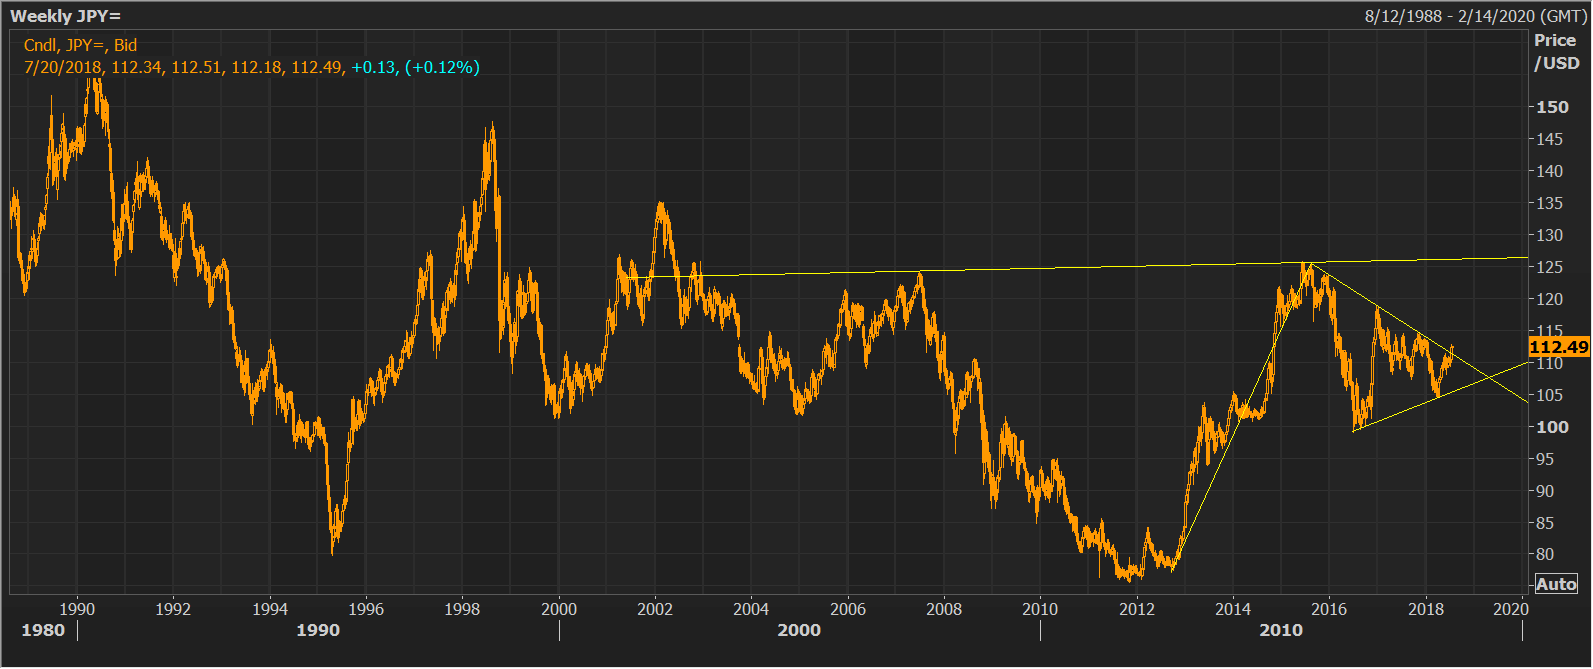
Further, if we zoom out on the weekly chart (include more historical data), it appears the pair has witnessed a bull pennant breakout - a continuation pattern, which indicates the rally from the 2011 low of 75.56 has resumed and as per the measured height method, could be extended to 160.
While that target looks far-fetched, USD/JPY could rally to 126.40 (neckline) over the next 12 months on pennant breakout, meaning the doors have been opened for a completion of the inverse head-and-shoulders pattern.
The macro factors also favor completion of the inverse head-and-shoulders pattern. The Fed-BOJ policy divergence is set to widen further over the next 12-18 months. Further, trade wars could keep Yuan and other Asian currencies on the back foot, thus limiting the upside in Japanese Yen.
View
Pennant breakout has opened doors for a rally to 126.40 (neckline of the inverse head-and-shoulders pattern) over the next 12 months.
Multiple weekly closes above 126.40 would mean a multi-decade bear-to-bull trend change.
Only a move below the recent low of 104.63 would invalidate the bullish view.
Author

Omkar Godbole
FXStreet Contributor
Omkar Godbole, editor and analyst, joined FXStreet after four years as a research analyst at several Indian brokerage companies.


