The Dollar-Yen pair rose to a high of 109.66 on Tuesday and extended gains to a fresh 4-day high of 109.83 earlier today before deflating to 109.37 levels. The bid tone around the Japanese Yen strengthened in Asia after President Trump, while speaking in Arizona, said “we are building that [Mexico] Wall even if we have to close down our government”. 

The Tuesday’s gains are also being blamed on the rise in the US 10-year Treasury yield from 2.18% to 2.215%. However, the spread or curve between the 10-year yield and the 2-year yield barely moved and remains well below the recent high of 92 basis points. 

Technicals - Double bottom on the daily chart

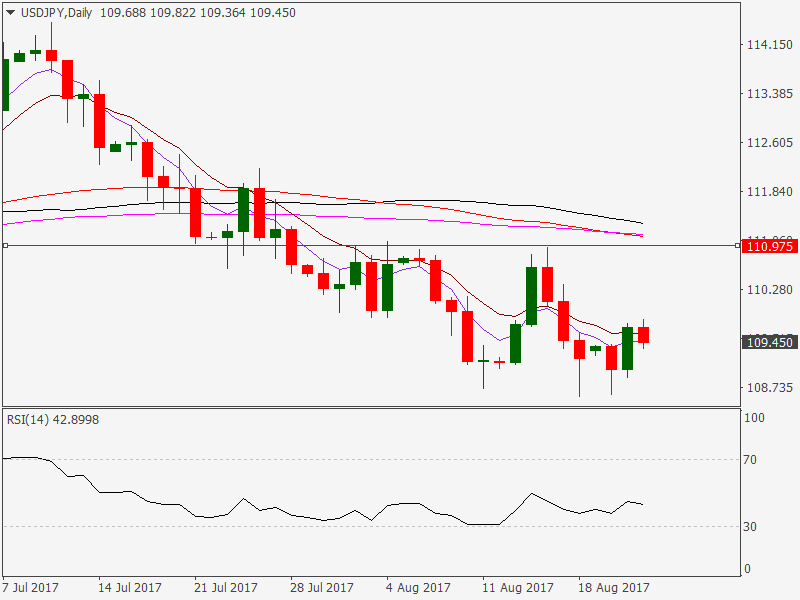
Multiple daily candles with long tails [dip demand below 109.00] and bullish follow through on Tuesday indicates the scope for a rally to 110.95 [Aug 16 high]. Such a move would mark the completion of a double bottom pattern. 

Strong resistance at 109.69

  • However, there is a strong resistance at 109.69 [Flag bottom]. The decline seen today from the high of 109.82 to 109.37 marks the failure to hold above 109.69. 
  • Only an end of the week close above 109.69 would signal add credence to the double bottom formation argument. 
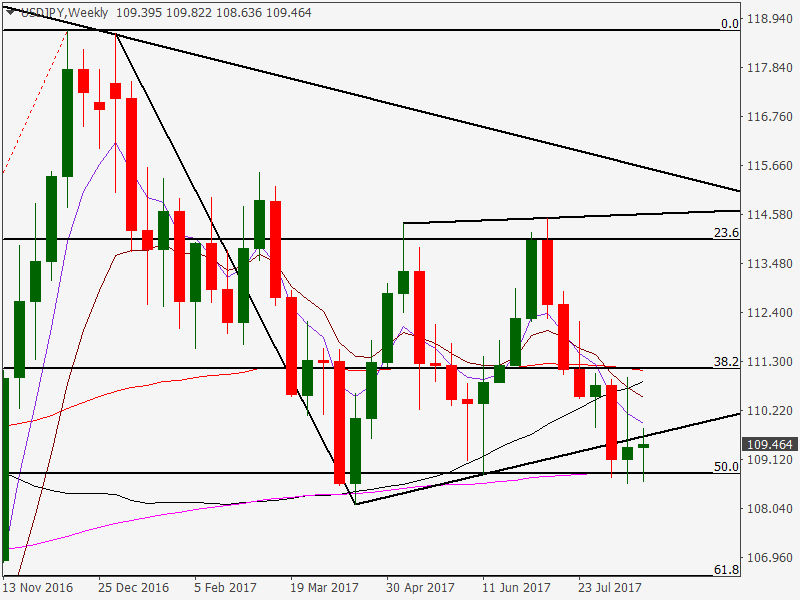
  • On the downside, an end of the day close below 109.00 would add credence to the bearish flag breakdown on the weekly chart and shall open doors for a sell-off to 106.00-105.50 levels.

Risk reversal supports rally

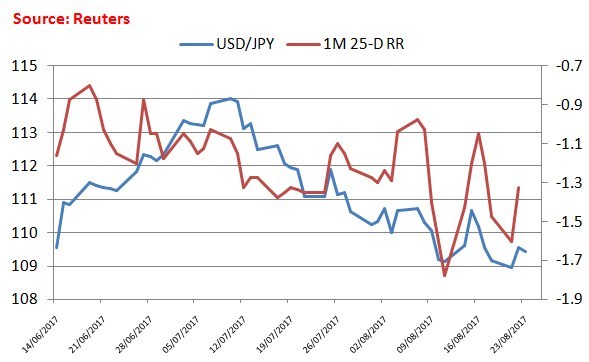
The one-month 25-delta risk reversal improved to -1.325 on Tuesday from the Monday’s print of -1.60. It highlights the drop in demand for Put options and supports the bullish pattern seen on the daily chart. 

The yield curve is yet to break higher in favor of the USD

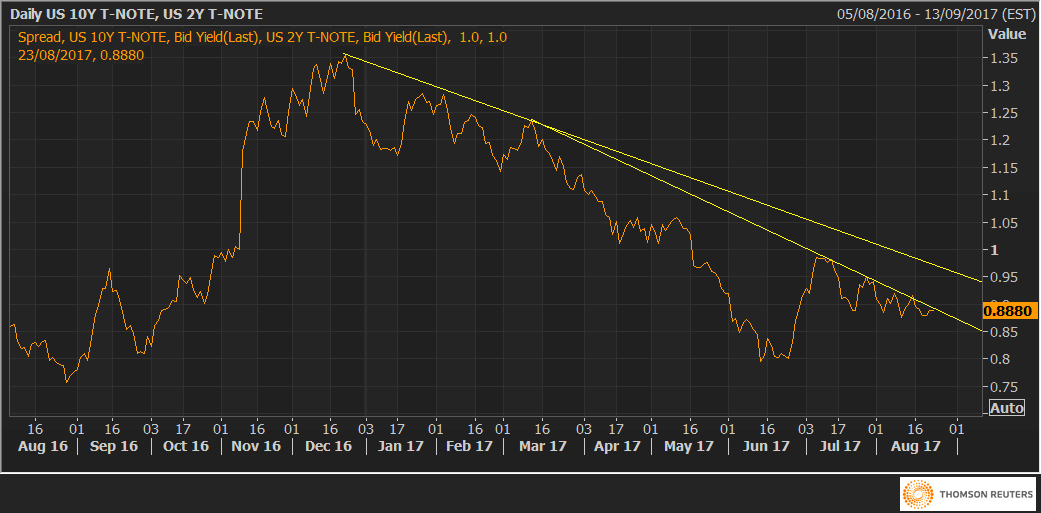
The curve or the spread between the 10-year Treasury yield and the 2-year Treasury yield still warrants caution on the part of the dollar bulls, given it is stuck at the falling trend line hurdle of 0.90 basis points. A break higher could lift the USD/JPY to the double bottom neckline level of 110.95. 

A bullish double bottom reversal would look for more convincing if it is accompanied by break above 0.96 basis points on the yield curve [larger falling trend line hurdle]. 

View:

  • Bearish momentum appears to have run out of steam as suggested by the candlestick pattern on the daily chart and an improvement in the risk reversal. 
  • However, a sustained rally to 110.95 and above would need steepening of the yield curve. 
  • An end of the day close below 109.00 would be bearish. 

Information on these pages contains forward-looking statements that involve risks and uncertainties. Markets and instruments profiled on this page are for informational purposes only and should not in any way come across as a recommendation to buy or sell in these assets. You should do your own thorough research before making any investment decisions. FXStreet does not in any way guarantee that this information is free from mistakes, errors, or material misstatements. It also does not guarantee that this information is of a timely nature. Investing in Open Markets involves a great deal of risk, including the loss of all or a portion of your investment, as well as emotional distress. All risks, losses and costs associated with investing, including total loss of principal, are your responsibility. The views and opinions expressed in this article are those of the authors and do not necessarily reflect the official policy or position of FXStreet nor its advertisers. The author will not be held responsible for information that is found at the end of links posted on this page.

If not otherwise explicitly mentioned in the body of the article, at the time of writing, the author has no position in any stock mentioned in this article and no business relationship with any company mentioned. The author has not received compensation for writing this article, other than from FXStreet.

FXStreet and the author do not provide personalized recommendations. The author makes no representations as to the accuracy, completeness, or suitability of this information. FXStreet and the author will not be liable for any errors, omissions or any losses, injuries or damages arising from this information and its display or use. Errors and omissions excepted.

The author and FXStreet are not registered investment advisors and nothing in this article is intended to be investment advice.

Recommended Content


Recommended Content

Editors’ Picks

AUD/USD failed just ahead of the 200-day SMA

AUD/USD failed just ahead of the 200-day SMA

Finally, AUD/USD managed to break above the 0.6500 barrier on Wednesday, extending the weekly recovery, although its advance faltered just ahead of the 0.6530 region, where the key 200-day SMA sits.

AUD/USD News

EUR/USD met some decent resistance above 1.0700

EUR/USD met some decent resistance above 1.0700

EUR/USD remained unable to gather extra upside traction and surpass the 1.0700 hurdle in a convincing fashion on Wednesday, instead giving away part of the weekly gains against the backdrop of a decent bounce in the Dollar.

EUR/USD News

Gold keeps consolidating ahead of US first-tier figures

Gold keeps consolidating ahead of US first-tier figures

Gold finds it difficult to stage a rebound midweek following Monday's sharp decline but manages to hold above $2,300. The benchmark 10-year US Treasury bond yield stays in the green above 4.6% after US data, not allowing the pair to turn north.

Gold News

Ethereum suffers slight pullback, Hong Kong spot ETH ETFs to begin trading on April 30

Ethereum suffers slight pullback, Hong Kong spot ETH ETFs to begin trading on April 30

Ethereum suffered a brief decline on Wednesday afternoon despite increased accumulation from whales. This follows Ethereum restaking protocol Renzo restaked ETH crashing from its 1:1 peg with ETH and increased activities surrounding spot Ethereum ETFs.

Read more

Dow Jones Industrial Average hesitates on Wednesday as markets wait for key US data

Dow Jones Industrial Average hesitates on Wednesday as markets wait for key US data

The DJIA stumbled on Wednesday, falling from recent highs near 38,550.00 as investors ease off of Tuesday’s risk appetite. The index recovered as US data continues to vex financial markets that remain overwhelmingly focused on rate cuts from the US Fed.

Read more

Majors

Cryptocurrencies

Signatures