USD/JPY Forecast: Bears likely to explore levels towards 105.50

The Dollar-Yen pair fell one full figure to 109.15 yesterday and closed at 109.21; the lowest end of the day close since April 20. The sell-off could be attributed to risk aversion, dismal US PPI reading and dovish comments from the Fed officials. The offered tone remained intact in Asia, with the pair falling to 108.90. The spot was last seen trading around 109.00 handle.
The US CPI due at 12:30 GMT is expected to show the cost of living rose 0.2% m/m in July. More importantly, the core CPI is seen rising 0.2%. If the data does match/beat expectations, it would mark an end of the fourth month streak of weaker-than-expected figures.
A better-than-expected core CPI could lift USD/JPY pair and vice versa. Technicals indicate the doors have been opened for a sell-off towards support around 105.50 levels.
Technicals
Support
108.80
108.13
106.64 [38.2% Fib R of 2011 low - 2015 high]
106.02 [weekly 200-MA]
Resistance
109.11 [June low]
109.88 [5-DMA] and 110.15 [10-DMA]
111.00
111.30 [100-DMA]
Daily chart
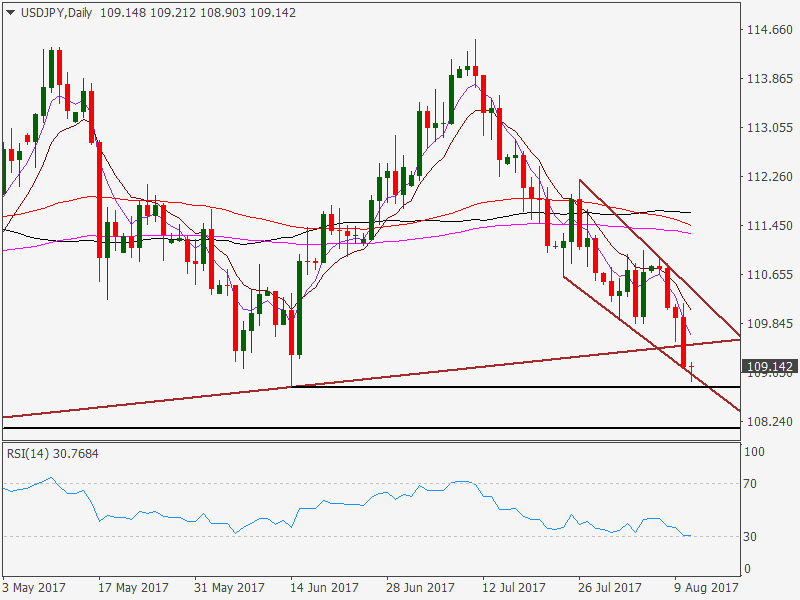
- The weakest daily close since April signals continuation of the sell-off from the recent high of 114.49. The support is seen around 108.80 and 108.13.
- The 14-day RSI is close to being oversold, hence a minor pull back cannot be ruled out, although the on a larger scheme of things, the outlook remains bearish as discussed below.
Weekly Chart - Bearish continuation pattern
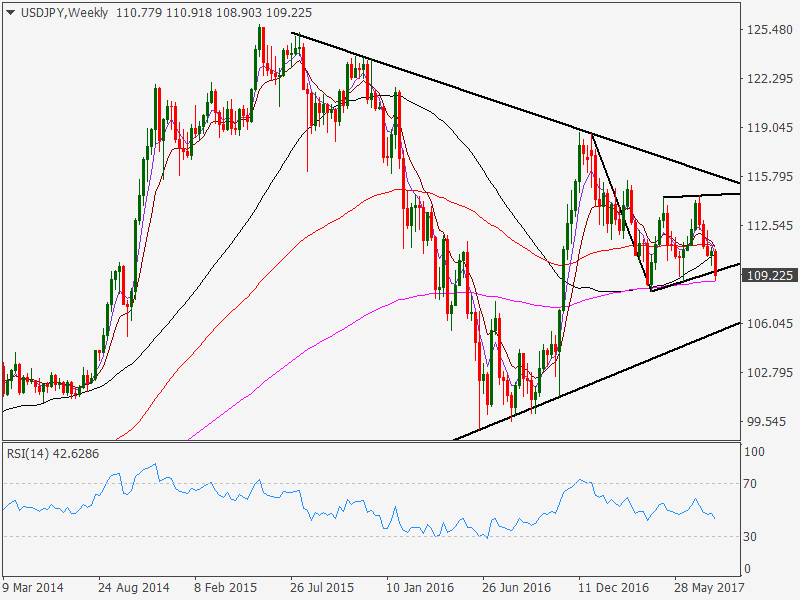
- What we have here is an inverted flag formation [bearish continuation pattern] inside a bigger falling tops formation.
- The trend line sloping upwards from 2011 low is seen offering support around 105.50 levels.
- Given the bearish RSI and the falling tops formation, the spot is more likely to confirm a downside break of the inverted flag pattern, in which case the bears are likely to attack 105.50 levels.
- On the higher side, only a weekly close above 111.24 [weekly 100-MA] would signal bearish invalidation.
View
- Short-term pullback likely on strong US CPI, but gains likely to be capped around 111.00
- A close below 109.36 could yield 105.50 over the next few weeks
Author

Omkar Godbole
FXStreet Contributor
Omkar Godbole, editor and analyst, joined FXStreet after four years as a research analyst at several Indian brokerage companies.

















