- US and Japan central banks use similar policies, but with different results.
- US government bond yields will guide USD/JPY amid persistent uncertainty.
- The USD/JPY pair is set to retest the 2015 high at 125.85 in 2022.
The USD/JPY pair started the year trading at 103.15, and it's ending it roughly 1000 pips higher in the 113.00 region. In November, it peaked at 115.51, its highest since January 2016.
Inflation, yields and sentiment
As usual, risk-related sentiment led the way for the pair, which made most of its gains in the first quarter of the year, as mounting inflationary pressures sent the yield on the 10-year US Treasury note to 1.746%. US government bond yields are the ultimate measure of risk sentiment but also indicate how speculative interest perceives inflation.
Yields move inversely to bond prices. When the market is optimistic, it demands fewer bonds and seeks high-yielding assets instead. Yields need to deliver a more attractive return for governments to raise money. Yet, at the same time, and as inflation tends to erode the value of future coupons and principal repayments, yields rise when price pressure mounts. The pair peaked at 110.99 in March 2021, spending the next few months consolidating to resume its advance in October, when the yield on the mentioned 10-year bond flirted again with the 1.70% threshold.
The US Consumer Price Index rose 0.6% in March from the previous month and 2.6% from a year ago, according to the Labor Department. Back then, market players were optimistic the end of the pandemic was around the corner, and policymakers blamed higher inflation on the solid economic recovery, and claimed it would be “temporary.”
Nobody figured out back then that US inflation would rise at an annual pace of 6.2% in October, the sharpest increase in 31 years. Policymakers maintained the “transitory” word when defining inflation but added that it might persist by longer than initially estimated. Supply chain issues and higher oil prices were liable to increase price pressures.
In contrast, Japan's Consumer Price Index rose by 0.1% YoY in October 2021. The Bank of Japan has been fighting deflation for over a decade, to no avail. Slowing economic growth starting a couple of decades ago pushed the Bank of Japan into a massive bond-buying program that it maintains today. This was partly because the pandemic was a global phenomenon so it forced policymakers everywhere into boosting financial support to keep borrowing costs near zero and entice consumers and companies to spend more.
BOJ and the Fed are facing different challenges
Early in December, the BOJ announced its decision on monetary policy. The benchmark interest rate was kept at -0.1%, as well as the yield-curve control, which aims for the 10-year bond to yield to stay at around 0.0%. At the same time, policymakers announced plans to scale back emergency financial support by March 2022, as planned. They also decided to extend the loan scheme for smaller companies until September 2022.
The central bank forecasted 0% inflation for the fiscal year that ends in March 2022.
“Japan's economy has picked up as a trend, although it has remained in a severe situation due to the impact of COVID-19 at home and abroad. Overseas economies have recovered on the whole, albeit with variation across countries and regions. In this situation, exports and industrial production have continued to increase as a trend, despite remaining weak due to the effects of supply-side constraints,” the latest BOJ’s statement reads.
The Japanese government is considering raising its economic growth forecast for the next fiscal year, to take into account the effects of its record $490 billion stimulus package.
The US Federal Reserve announced it will start trimming its pandemic-support program in November and doubled it in December, to $30 billion, from $15 billion as announced previously, starting January 2022. That means the central bank will stop buying $20 billion Treasuries and $10 billion Mortgage-Backed Securities per month.
US inflation forecasts, according to the Fed, have been raised to 5.6% for 2021 and to 2.6% for 2022, up from 4.2% and 2.2% previously. The Gross Domestic Product is now projected at 4% in 2022, up from the previous median forecast of 3.8%, while the economy is estimated to grow 2.2% in 2023, down from the 2.5% from September.
No end in sight for Japan’s stagnation
The two countries seem to be in different worlds, as while inflation skyrockets in the US, it remains flat in Japan. At this point, and since “Abenomics” came into play back in 2013, it has not been a game-changer for USD/JPY after the initial impact. Japanese policymakers have maintained rates negative and ultra-loose quantitative easing for over almost a decade, but the results have been scarce, to say the least.
The pandemic has been blamed for skyrocketing inflation in most of the Eastern world, as well as higher inflation in New Zealand and Australia. How come Japanese inflation is not showing signs of life?
It could be partially explained as a cultural factor. Consumer’s expectations of lower prices made it impossible for companies to raise prices without risking angering people. Sluggish economic progress keeps wages steady, exacerbating consumers’ reluctance to pay higher prices. An ageing population is also a negative factor.
Following decades of substantial growth, Japan has suffered from stagnation, a condition marked by low inflation, low interest rates and sluggish growth, since the 1990 stocks’ bubble crisis.
Maybe it’s a good time to think about the role of the current monetary policies and their real impact on economic developments.
What’s next for USD/JPY?
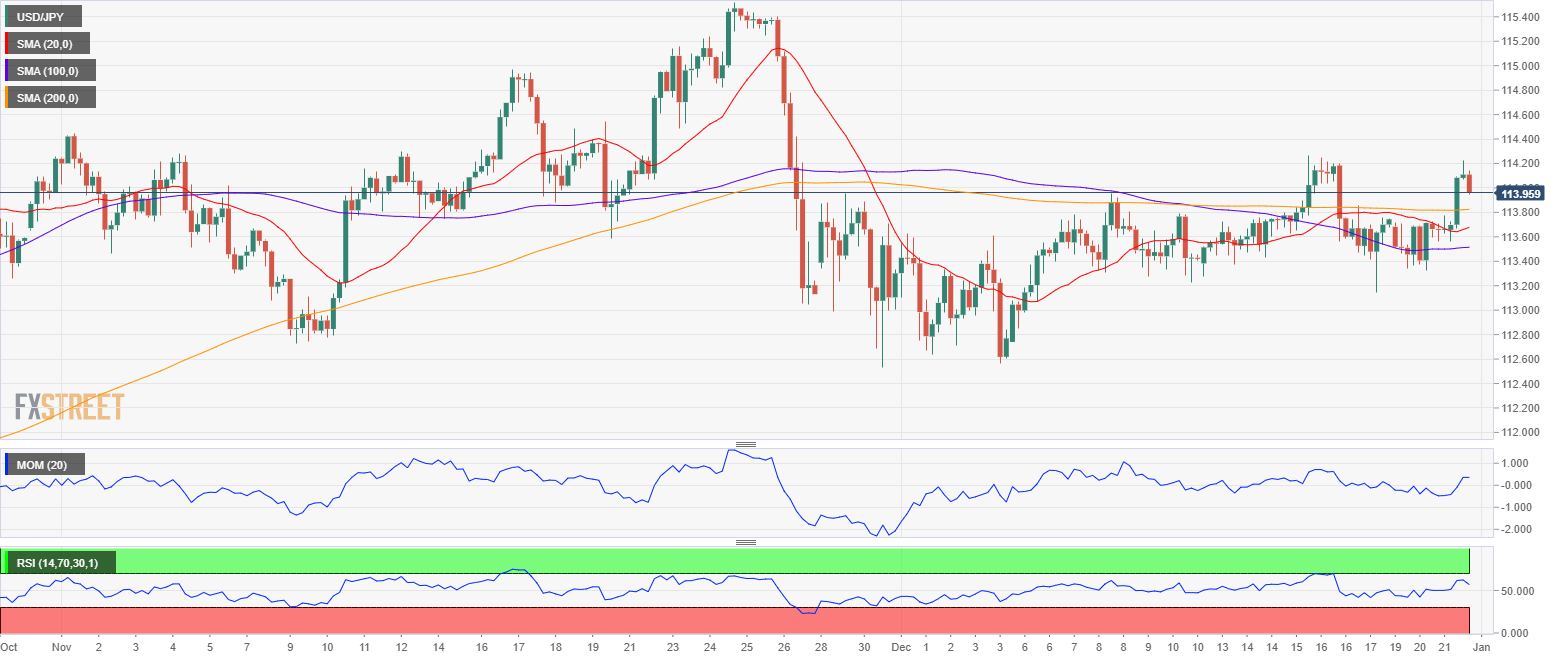
The USD/JPY pair has been on a long downtrend since June 2015, changing course in March 2021 after breaking a descending trend line drawn from 125.85. It took the pair six months to finally break higher and reach the yearly high at 115.51. From the current area, and once beyond that level, there’s little in the way of resistance until the 118.60 price zone, where the pair topped in December 2016 and January 2017.
The monthly chart shows that a strong static support level has formed in the 111.60 area, with a break below it exposing the 110.00 region. It would take a break below 107.70 for bears to regain long-term control.
Technically speaking, the long-term perspective is bullish. In the mentioned monthly chart, the pair is developing above all its moving averages, with the 100 SMA currently at around 110.10, reinforcing the static support area. Technical indicators are advancing within positive levels, with room to extend gains but a lack of momentum.
Bulls are in control in the weekly chart, with the pair offering a firmer upward potential. The 20 SMA is advancing above the longer ones, while technical indicators resumed their advances after correcting overbought conditions, hinting at increasing buying interest.
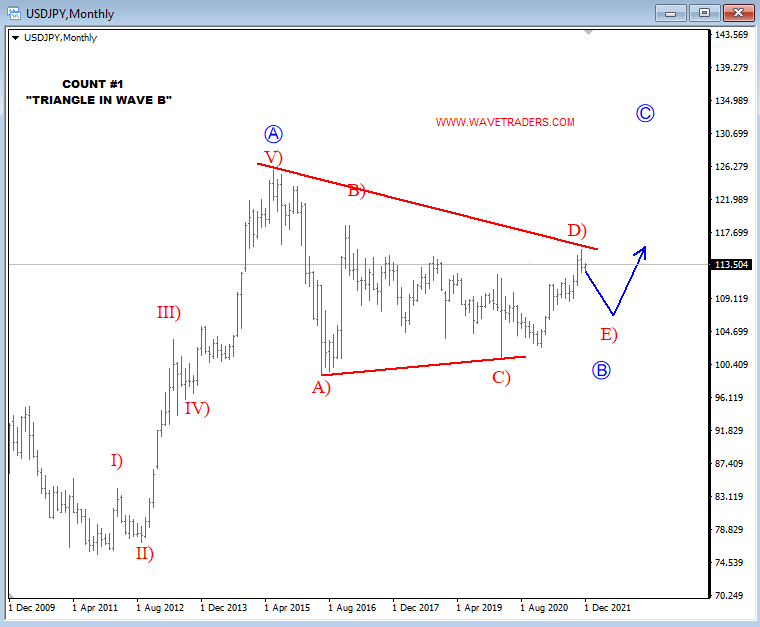
Gregor Horvat projects a bullish continuation for the yen/dollar pair on his Elliott Wave analysis:
USD/JPY Elliott Wave Analysis
 by Gregor Horvat
USDJPY came higher in 2021 on speculation above FED tapering which was delivered in November. USD moved higher with US yields, but pair is now at the upper side of a five-year range, so we should be aware of a potential slow down. Ideally, that’s going to be wave E) pullback of B triangle that can cause more upside in second part of 2022.
Forecast Poll 2022
| Forecast | Q1 - Mar 31st | Q2 - Jun 30th | Q4 - Dec 31st |
|---|---|---|---|
| Bullish | 26.92% | 25.81% | 37.50% |
| Bearish | 7.69% | 12.90% | 43.75% |
| Sideways | 65.38% | 61.29% | 6.25% |
| Average Forecast Price | 114.0723 | 114.8219 | 115.9509 |
| EXPERTS | Q1 - Mar 31st | Q2 - Jun 30th | Q4 - Dec 31st |
|---|---|---|---|
| Alberto Muñoz | 116.0000 Bullish | 118.7500 Bullish | 122.0000 Bullish |
| Andrew Lockwood | 113.5000 Sideways | 115.0000 Sideways | 117.0000 Sideways |
| ANZ FX Strategy Team | 116.0000 Bullish | 116.0000 Sideways | 116.0000 Sideways |
| Brad Alexander | 115.0000 Sideways | 118.0000 Bullish | 122.0000 Bullish |
| Brian Wang | 118.4200 Bullish | 115.8900 Sideways | 120.6500 Bullish |
| Barclays | 114.6700 Sideways | 115.6700 Sideways | 115.3300 Sideways |
| BMO Capital Markets Team | 114.0000 Sideways | 114.0000 Sideways | 113.0000 Sideways |
| BNP Paribas Team | 115.6700 Sideways | 117.6700 Bullish | |
| BoA FX Rates and Commodities Team | 116.0000 Bullish | 117.3300 Bullish | 118.0000 Bullish |
| Frank Walbaum | 111.5000 Sideways | 110.0000 Bearish | 106.0000 Bearish |
| CIBC World Markets Team | 114.6700 Sideways | 115.6700 Sideways | 114.3300 Sideways |
| CitiFX | 115.0000 Sideways | 115.6700 Sideways | 115.3300 Sideways |
| Commerzbank Analyst Team | 116.6700 Bullish | 118.0000 Bullish | |
| DBS Group Research | 114.6700 Sideways | 115.6700 Sideways | 117.6700 Bullish |
| Goldman Sachs Global Investment Research | 115.0000 Sideways | 113.0000 Sideways | 111.0000 Sideways |
| ING Global Economics Team | 113.6700 Sideways | 114.6700 Sideways | 119.3300 Bullish |
| JP Morgan | 116.6700 Bullish | 116.3300 Sideways | |
| Matias Salord | 111.7500 Sideways | 109.6500 Bearish | 116.7000 Sideways |
| NAB Global Markets Research | 111.3300 Bearish | 111.6700 Sideways | 111.0000 Sideways |
| NatWest Markets | 117.6700 Bullish | 119.6700 Bullish | |
| Navin Prithyani | 112.0000 |