EUR/USD
Weak bounce thus far.
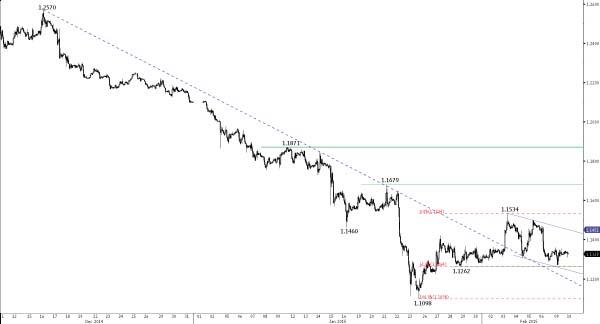
EUR/USD has thus far successfully tested the support at 1.1262. However, the current weak bounce suggests persistent selling pressures. Hourly resistances can be found at 1.1431 (intraday low) and 1.1534. Another support lies at 1.1098.
In the longer term, the symmetrical triangle favours further weakness towards parity. As a result, the recent strength is likely to be temporary. A resistance lies at 1.1679 (21/01/2015 high), while a key resistance stands at 1.1871 (12/01/2015 high). Key supports can be found at 1.1000 (psychological support) and 1.0765 (03/09/2003 low).
Await fresh signal.
GBP/USD
Declining trendline still in place.
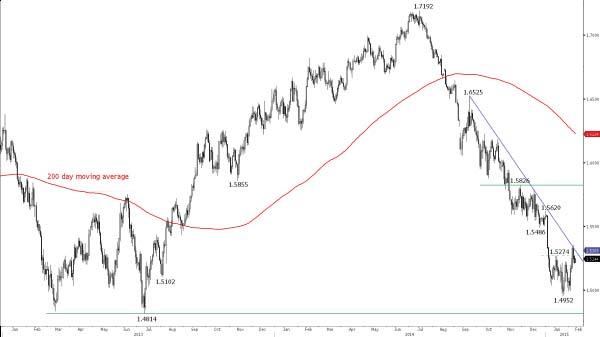
GBP/USD has broken the key resistance at 1.5274 (06/01/2015 high). Even if the declining trendline remains thus far intact, further strength towards the resistance at 1.5486 is favoured. Hourly supports now stand at 1.5201 (09/02/2015 low) and 1.5139 (04/02/2015 low). An hourly resistance can be found at 1.5352 (06/02/2015 high).
In the longer term, the break of the key resistance at 1.5274 (06/01/2015 high) suggests renewed buying interest. Upside potential are likely given by the resistances at 1.5620 (31/12/2014 high) and 1.5826 (27/11/2014 high). The strong support at 1.4814 should cap the medium-term downside risks.
Await fresh signal.
USD/JPY
The declining channel has held thus far.
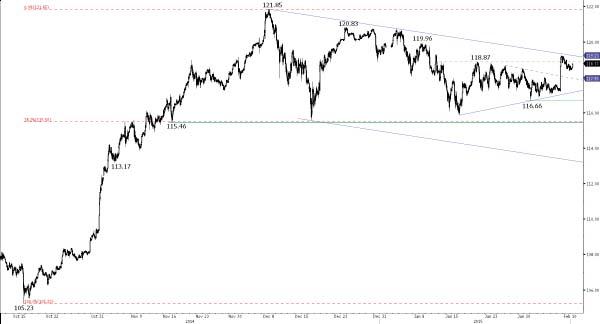
USD/JPY has thus far failed to break the resistance implied by its declining channel (around 119.23). A break to the upside would suggest abating medium-term selling pressures. An hourly support can be found at 118.00 (04/02/2015 low).
A long-term bullish bias is favoured as long as the key support 110.09 (01/10/2014 high) holds. Even if a medium-term consolidation is likely underway, there is no sign to suggest the end of the long-term bullish trend. A major resistance stands at 124.14 (22/06/2007 high). A key support can be found at 115.46 (17/11/2014 low).
Long 1 unit at 116.10, Obj: Close unit 1 at 119.30., Stop: 117.86 (Entered: 2015-01-16).
USD/CHF
Moving sideways.
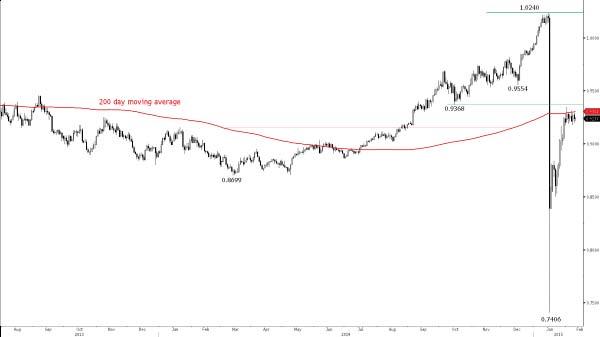
USD/CHF is consolidating below the resistance at 0.9368 (15/10/2014 low, see also the 200-day moving average). Hourly supports stand at 0.9170 (30/01/2015 low) and 0.8936 (27/01/2015 low). Another resistance lies at 0.9554 (16/12/2014 low).
Following the removal of the EUR/CHF floor, a major top has been formed at 1.0240. The break of the resistance implied by the 61.8% retracement of the sell-off suggests a strong buying interest. Another key resistance stands at 0.9554 (16/12/2014 low), whereas a strong support can be found at 0.8353 (intraday low).
Await fresh signal.
USD/CAD
Consolidating.
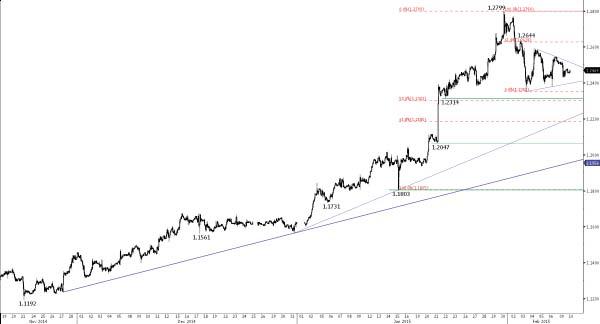
USD/CAD is consolidating above the key support at 1.2314. Hourly resistances can be found at 1.2644 (see also the 61.8% retracement) and 1.2799. Another support lies at 1.2185 (61.8% retracement, see also the steepest rising trendline).
In the longer term, the technical structure looks like a rounding bottom whose maximum upside potential is given by the strong resistance at 1.3065 (09/03/2009 high). Given the current overextended rise, the odds to see a consolidation phase are elevated. A key support stands at 1.2047 (intraday low).
Await fresh signal.
AUD/USD
Short-term bullish momentum fading?
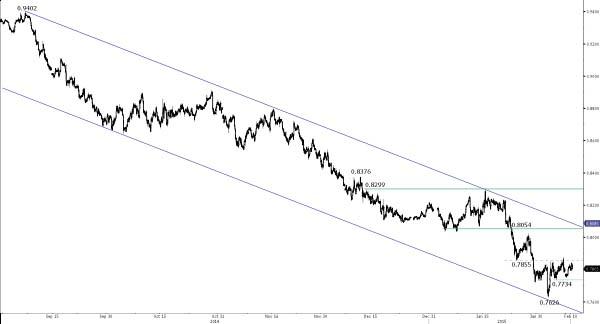
AUD/USD needs to decisively break the resistance at 0.7855/0.7876 (06/02/2015 high) to suggest further short-term upside potential. On the other hand, a break of the support at 0.7734 (05/02/2015 low) would signal the end of the current bounce. A key support stands at 0.7626, whereas a key resistance can be found at 0.8054 (23/01/2015 high).
In the long-term, there is no sign to suggest the end of the current downtrend. The break of the strong support area between 0.8067 (25/05/2010 low) and 0.7947 (61.8% retracement of the 2009-2011 rise) favours further weakness. A key support stands at 0.7451 (18/05/2009 low). A break of the key resistance at 0.8295 (15/01/2015 high) is needed to invalidate our long-term bearish view.
Await fresh signal.
GBP/JPY
A new phase of strength is expected.
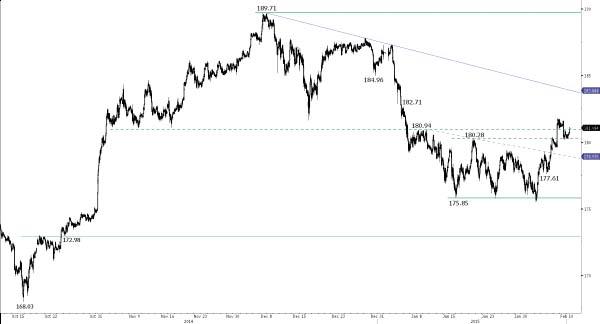
GBP/JPY has broken the key resistance area between 180.28 and 180.94. This validates a bullish reversal pattern with an upside potential at 184.70. The hourly support at 180.28 (previous resistance) has induced some buying interest. Another hourly support lies at 179.59 (06/02/2015 low). An hourly resistance can now be found at 181.81 (06/02/2015 high).
In the long-term, the lack of any medium-term bearish reversal pattern favours a bullish bias. A support is given by the 200-day moving average (around 176.30), while a strong support area lies between 169.51 (11/04/2014 low) and 167.78 (18/03/2014 low). A strong resistances stands at 190.00 (psychological threshold).
Buy limit 2 units at 179.61, Obj: Close unit 1 at 181.78, remaining at 184.35, Stop: 178.55.
EUR/JPY
Monitor the resistance at 135.36.
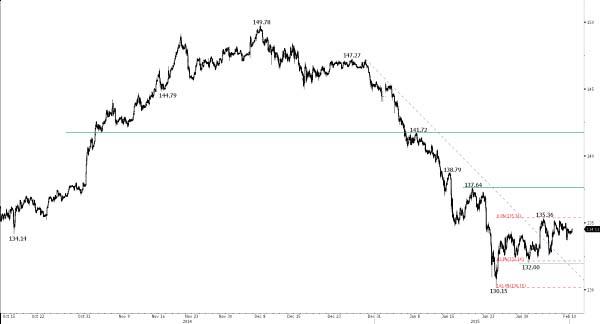
EUR/JPY is showing some signs of weakness near the resistance at 135.36. A break of this level is needed to open the way for a short-term rise towards the key resistance stands at 137.64. Hourly supports can now be found at 133.68 (09/02/2015 low) and 132.00.
In the longer term, the break of the strong support at 134.11 (20/11/2013 low) invalidates the long-term succession of higher lows. The resistance at 149.78 (08/12/2014 high) has likely marked the end of the rise that started in July 2012. More sideways moves are now expected. A key support stands at 124.97 (13/06/2013 low).
Await fresh signal.
EUR/GBP
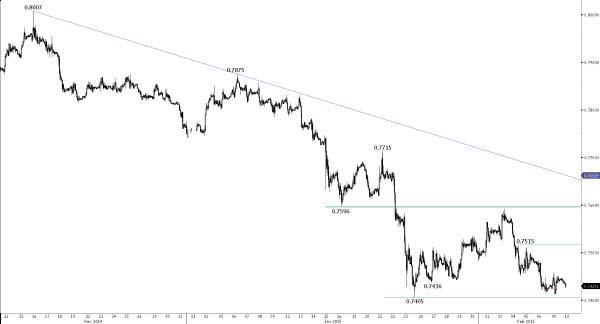
Monitor the support at 0.7405.
EUR/GBP remains weak near the support at 0.7405, suggesting persistent selling pressures. Hourly resistances stand at 0.7515 and 0.7596.
In the long-term, the break of the major support area between 0.7755 (23/07/2012 low) and 0.7694 (20/10/2008 low) confirms an underlying downtrend. Monitor the test of the support at 0.7392 (28/01/2008 low). Another support can be found at 0.7089 (03/12/2007 low). A key resistance now lies at 0.7875 (25/12/2014 high).
Short 1 unit at 0.7563, Obj: Close remaining at 0.7260, Stop: 0.7535 (Entered: 2015-02-03).
EUR/CHF
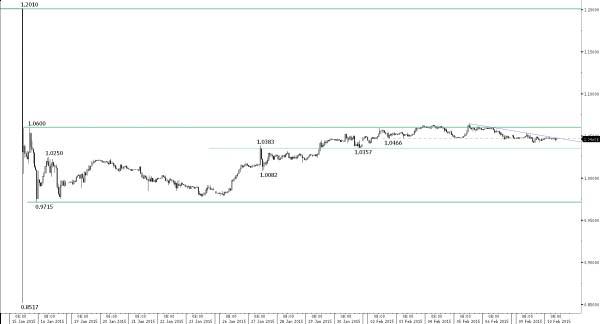
Fading near the key resistance at 1.0600.
EUR/CHF is recovering after its recent massive sell-off. The key resistance at 1.0600 has held thus far. The break of the hourly support at 1.0466 signals a weakening short-term bullish momentum. Supports now lie at 1.0357 and 1.0184 (28/01/2015 low). Another resistance can be found at 1.0675 (61.8% retracement of the 15 January decline).
The EUR/CHF is again a free-floating currency and has declined to uncharted water. The ECB's QE programme is likely to cause persistent selling pressures on EUR/CHF. As a result, the key resistance at 1.0600 should be hard to break. A key support stands at 0.9715.
Await fresh signal.
GOLD (in USD)
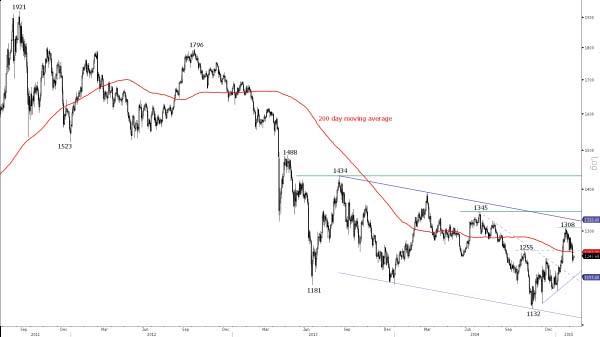
Bearish breakout of the support at 1255.
Gold has broken the support at 1255 (16/01/2015 low), confirming persistent selling pressures. The current bounce near the support at 1225 (14/01/2015 low) is thus far unimpressive. Other supports stand at 1205 (08/01/2015 low) and 1168 (02/01/2015 low). Hourly resistances can be found at 1256 (05/02/2015 low) and 1286 (03/02/2015 high).
In the long-term, the break of strong resistance at 1255 (21/10/2014 high, see also the 200-day moving average) indicates an improving technical structure. However, the shape of this advance still looks like a countertrend move within an underlying downtrend and the declining channel suggests a limited upside potential. Another key resistance stands at 1345 (10/07/2014 high).
Await fresh signal.
SILVER (in USD)
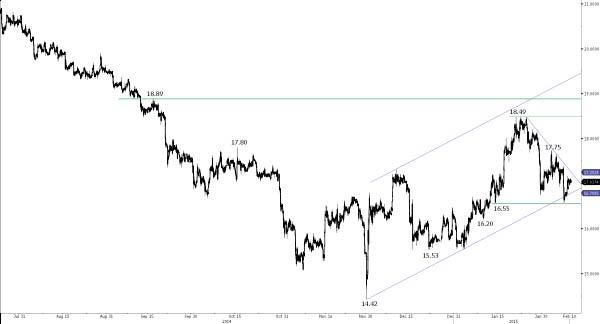
Remains below its declining trendline.
Silver has bounced near the key support at 16.55 (see also the rising channel). However, the persistent succession of lower highs favours a bearish bias. Hourly resistances can be found at 17.18 (intraday low) and 17.38 (06/02/2015 high). Another key support can be found at 15.53.
In the long-term, the break of the major support area between 18.64 (30/05/2014 low) and 18.22 (28/06/2013 low) confirms an underlying downtrend. Although the strong support at 14.66 (05/02/2010 low) has held thus far, the lack of any base formation continues to favour a long-term bearish bias. A key resistance stands at 18.89 (16/09/2014 high).
Await fresh signal.
This report has been prepared by Swissquote Bank Ltd and is solely been published for informational purposes and is not to be construed as a solicitation or an offer to buy or sell any currency or any other financial instrument. Views expressed in this report may be subject to change without prior notice and may differ or be contrary to opinions expressed by Swissquote Bank Ltd personnel at any given time. Swissquote Bank Ltd is under no obligation to update or keep current the information herein, the report should not be regarded by recipients as a substitute for the exercise of their own judgment.
Recommended Content
Editors’ Picks
EUR/USD clings to marginal gains above 1.0750

EUR/USD trades in positive territory above 1.0750 in the second half of the day on Monday. The US Dollar struggles to find demand as investors reassess the Fed's rate outlook following Friday's disappointing labor market data.
GBP/USD edges higher toward 1.2600 on improving risk mood

Following Friday's volatile action, GBP/USD pushes higher toward 1.2600 on Monday. Soft April jobs report from the US and the modest improvement seen in risk mood make it difficult for the US Dollar to gather strength.
Gold climbs above $2,320 as US yields push lower

Gold trades decisively higher on the day above $2,320 in the American session. Retreating US Treasury bond yields after weaker-than-expected US employment data and escalating geopolitical tensions help XAU/USD stretch higher.
Addressing the crypto investor dilemma: To invest or not? Premium

Bitcoin price trades around $63,000 with no directional bias. The consolidation has pushed crypto investors into a state of uncertainty. Investors can expect a bullish directional bias above $70,000 and a bearish one below $50,000.
Three fundamentals for the week: Two central bank decisions and one sensitive US Premium

The Reserve Bank of Australia is set to strike a more hawkish tone, reversing its dovish shift. Policymakers at the Bank of England may open the door to a rate cut in June.
