Jobs miss, markets roar

USD: Jun '24 is Up at 104.950.
Energies: Jun '24 Crude is Up at 78.90.
Financials: The June '24 30 Year T-Bond is Up 9 ticks and trading at 116.07.
Indices: The Jun '24 S&P 500 emini ES contract is 68 ticks Higher and trading at 5171.75.
Gold: The Jun'24 Gold contract is trading Up at 2330.10
Initial conclusion
This is not a correlated market. The USD is Up and Crude is Up which is not normal, and the 30 Year T-Bond is trading Higher. The Financials should always correlate with the US dollar such that if the dollar is Higher, then the bonds should follow and vice-versa. The S&P is Higher and Crude is trading Higher which is not correlated. Gold is trading Higher which is not correlated with the US dollar trading Up. I tend to believe that Gold has an inverse relationship with the US Dollar as when the US Dollar is down, Gold tends to rise in value and vice-versa. Think of it as a seesaw, when one is up the other should be down. I point this out to you to make you aware that when we don't have a correlated market, it means something is wrong. As traders you need to be aware of this and proceed with your eyes wide open. Asia is trading Higher with the exception of the Nikkei exchange. Currently all of Europe is trading Higher.
Possible challenges to traders
-
FOMC Member Barkin Speaks at 12:50 PM EST. This is Major.
-
FOMC Member Williams Speaks at 1 PM EST. This is Major.
-
Loan Officer Survey - tentative. This is Major.
Treasuries
Traders, please note that we've changed the Bond instrument from the 30 year (ZB) to the 10 year (ZN). They work exactly the same.
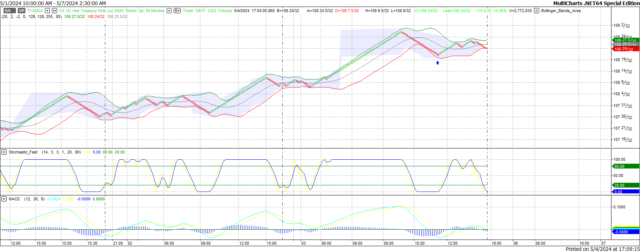
We've elected to switch gears a bit and show correlation between the 10-year bond (ZN) and the S&P futures contract. The S&P contract is the Standard and Poor's, and the purpose is to show reverse correlation between the two instruments. Remember it's likened to a seesaw, when up goes up the other should go down and vice versa.
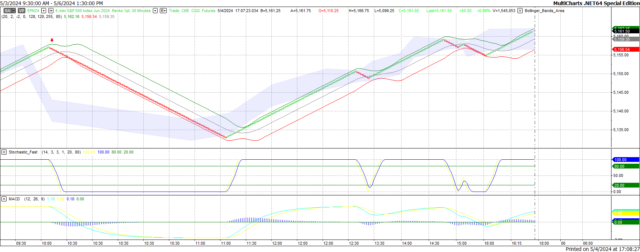
On Friday the ZN migrated Higher at around 10:30 AM EST as the S&P hit a High at around that time and the ZN hit a Low moving Higher. If you look at the charts below the ZN gave a signal at around 10:30 AM and started its Upward climb. Look at the charts below and you'll see a pattern for both assets. S&P moving Lower at around 10:30 AM and the ZN moving Higher at around the same time. These charts represent the newest version of MultiCharts and I've changed the timeframe to a 15-minute chart to display better. This represented a Long opportunity on the 10-year note, as a trader you could have netted about a dozen ticks per contract on this trade. Each tick is worth $15.625. Please note: the front month for both the ZN and the S&P are now Jun '24. I've changed the format to filled Candlesticks (not hollow) such that it may be more apparent and visible.
Charts courtesy of MultiCharts built on an AMP platform
ZN -Jun 2024 - 05/03/24
S&P - Jun 2024 - 05/03/24
Bias
On Friday we suggested a Neutral or Mixed bias as it was Jobs Friday, and we always maintain a Neutral bias on that day. Why? Because the markets have never shown any sense of normalcy on that day. The Dow gained 450 points and the other indices gained ground as well. Today we aren't dealing with a correlated market and our bias is Neutral.
Could this change? Of Course. Remember anything can happen in a volatile market.
Commentary
So, the job numbers didn't come in according to expectation with the US economy gaining 175,000 net new jobs versus the expectation of 238,000. Yet the markets took off and roared. Why? Because the expectation is that this would give the Federal Reserve more of a reason to cut interest rates as opposed to a hike. If the Fed cut rates, it would help the housing markets in terms of New Home Sales and would give a boost to Consumer Spending as well. The banking industry would do well as this would serve to boost refinancing of existing mortgages. Of course, this is all subjective and only time will tell what the markets will do.
Author

Nick Mastrandrea
Market Tea Leaves


