USD/CAD Weekly forecast: One of a kind against the USD
- An excellent US NFP report failed to favor the USD/CAD.
- USD/CAD finished the week up one point at 1.2578.
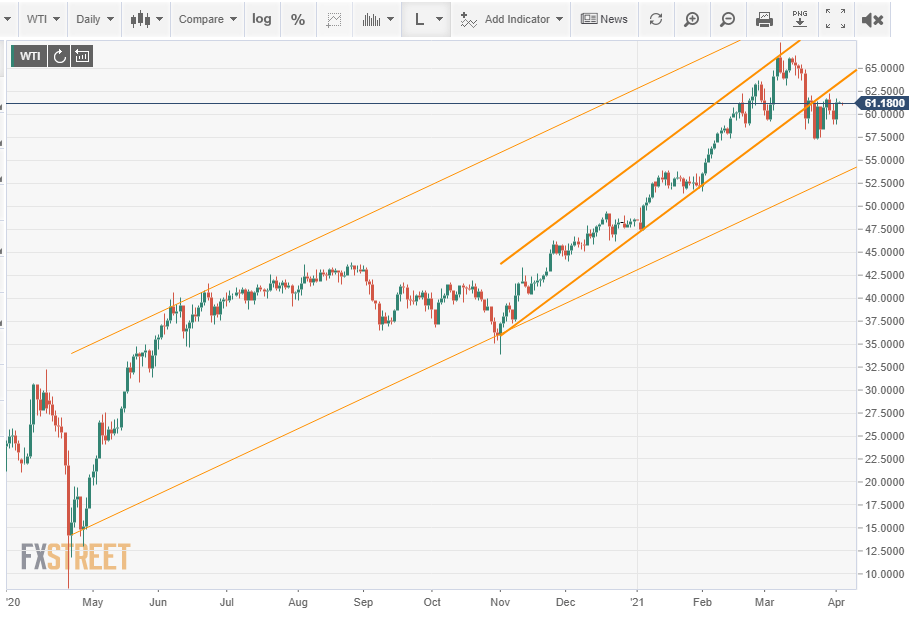
- West Texas Intermediate has stalled for two weeks.
- The FXStreet Forecast Poll sees upside failure then paralysis

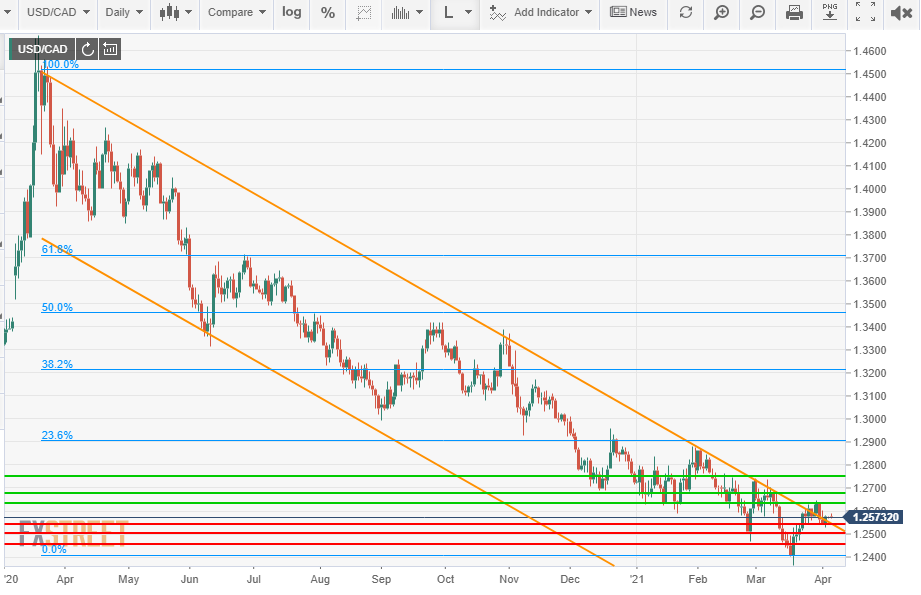
The weak attempt on Tuesday and Wednesday to break out of the pandemic declining channel failed at 1.2635 resistance, leaving the USD/CAD the sole major pair yet operational within its year-long parameters. All others have succumbed to a greater or lesser degree to the US dollar rate inspired rise. The USD/CAD finished the week at 1.2578 one point from its open on Monday.
Canada’s dollar is a special case among the USD based pairs and its unique conditions have kept the loonie near its three-year highs.
First, the gains in US Treasury yields have been largely matched by Canadian sovereign rates. Second, the pending if not imminent global recovery has given a 26% boost to the price of a barrel of West Texas Intermediate (WTI) the North American crude oil standard, this year. For the resource heavy Canadian economy that is money in the bank.
Finally, the American economic recovery which, after the exceptional Nonfarm Payrolls report in March, appears to be intact and accelerating, will have great positive impact north of the border. No two economies are as closely tied as those of the US and Canada.
American data was much more impressive this week, with the caveat above that what is good for the US is only slightly less beneficial to Canada.
An excellent March US payroll report was the most telling data. American employers hired 916,000 workers in March, more than 40% higher than the 647,000 forecast. First quarter employment jumped 1.55 million, a hiring pace that would eliminate the remaining Nonfarm Payroll losses by the middle of September.
Purchasing Managers’ Indexes in the manufacturing sector were exceptionally strong, with the headline score of 64.7 a 38-year high and New Orders expanding at a 17-year record for the ninth month in a row. The PMI readings for the service sector due on Monday should be equally strong.
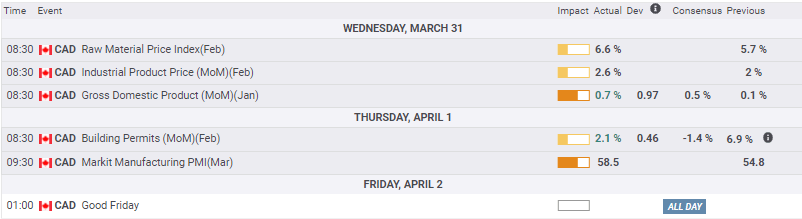
While Canada’s GDP in January was slightly better than expected and home construction continued at a near record pace neither could compare with the strength or import of the US Labor Department report.
USD/CAD outlook
The bracketing support and resistance lines, equally informed by recent trading, the balance between US and Canadian interest rates and the probable strong economic growth in both economies in the next few quarters leaves the USD/CAD without direction.
March's excellent payroll report underscores the potential for the US economy to reach the Fed's 6.5% projected 2021 expansion. Growth that rapid, combined with the Biden administration's apparent determination to flood the economy with spending, whether or not it is needed or can be used efficiently, puts a fire under inflation. The Fed governors know that higher medium to long-term rates are an effective hedge against changing inflation expectations but Canadian rates can be expected to keep pace.
The sideways price motion in WTI over the past two weeks has been the most influential indicator for the USD/CAD.
The inability to generate a rally in the USD/CAD this week despite the overall success of the USD and the technical opportunity means the stasis is likely to continue. Given the oppositional fundamental prospects the technical resistance and support will play the largest role and the failure above, tilts the immediate direction lower.
Canada statistics March 29-April 2
Wednesday
Raw Material Price Index February 6.6%, January 5.7%. Industrial Product Price February (MoM) 2.6%, January 2%. Gross Domestic Product January (MoM) 0.7%, expected 0.5%, December 0.1%.
Thursday
Building Permits February 2.1%, expected -1.45, January 6.9%. Markit Manufacturing PMI March 58.5, February 54.8.
US statistics March 29-April 2
March payrolls were much better than expected as were the Purchasing Managers’ Indexes from the Institute for Supply Management. The New Orders Index extended its best run in a generation to a ninth month. The Employment Index jumped to its best level since February 2018, it had been forecast to fall. The Manufacturing Indexes promise a strong start for the factory sector in the second quarter and are considered a leading indicator for the overall economy.
Tuesday
Conference Board Consumer Confidence Index March 109.7, expected 96.9, February 91.3. Conference Board Present Situation Index March 110.0, February 89.6. Conference Board Expectations Index 109.6, February 90.9.
Wednesday
ADP Employment Change march 517,000, expected 550,000, February 176,000 revised from 117,000.
Thursday
Initial Jobless Claims March 26 week 719,000, expected 680,000, prior week 658,000 revised from 684,000. Continuing Claims March 19 week 3.794 million, expected 3.775 million , prior week 3.84 million. ISM Manufacturing PMI March 64.7, expected 61.3, February 60.8. ISM Manufacturing New Orders March 68, February 64.8. ISM Manufacturing Employment Index March 59.6, expected 53, February 54.4. ISM Manufacturing Prices Paid Index March 85.6, expected 85, February 86. Construction Spending February -0.8%, expected -1%, January 1.2%.
Friday
Nonfarm Payrolls March 916,000, expected 647,000, February revised to 468,000 from 379,000. Unemployment Rate (U-3) March 6% as expected, February 6.2%. Average Hourly Earnings March (MoM) -0.1%, expected 0.2%, February 0.2%. Average Hourly Earnings March (YoY) 4.2%, expected 4.5%, February 5.2%. Average Weekly Hours March 34.9. expected 34.7, February 34.6. Underemployment Rate (U-6) March 10.7%, February 11.1%. Labor Force Participation Rate March 61.5%, February 61.4%.


FXStreet
Canada statistics April 5-April 9
Wednesday
Imports February, January C$49.78 billion. Exports February, January C$51.19 billion.International Merchandise Trade February expected C$1 billion, January C$1.41 billion. Ivey Purchasing Managers’ Index March, February 63.1.
Friday
Net Change in Employment March expected 90,000, February 259,200. Unemployment Rate March expected8%, February 8.2%. Participation Rate March, February 64.7%. Average Hourly Wages March (YoY), February 4.26%.

FXStreet
US statistics April 5-April 9
Services PMI should follow manufacturing higher with the Employment Index the most likely to garner a market response. There will be media talk about the FOMC minutes but nothing substantive will be relieved in the text.
Monday
ISM Services PMI March expected 57.4, February 55.3. ISM Services Employment Index March, February 52.7. ISM Services New Orders Index March, February 51.9. ISM Services Prices Paid March, February 71.8. Factory Orders February expected -0.3%, January 2.6%.
Tuesday IBD/TIPP Economic Optimism April, March 55.4. JOLTS Job Openings February, January 6.917 million.
Wednesday
FOMC Minutes of the March 16-17 meeting. Consumer Credit Change February expected $5 billion, January $-1.31 billion.
Thursday
Initial Jobless Claims April 2 week, prior 719,000. Continuing Claims March 26 week, prior 3.794 million.
Friday
Producer Price Index March (MoM) expected 0.5%, February 0.5%. Producer Price Index March (YoY) expected 2.7%, February 2.8%. Producer Price Index ex Food & Energy March (MoM) expected 0.2%, February 0.2%. Producer Price Index ex Food & Energy March (YoY) expected 2.6%, February 2.5%. IMF Meeting.


USD/CAD technical outlook
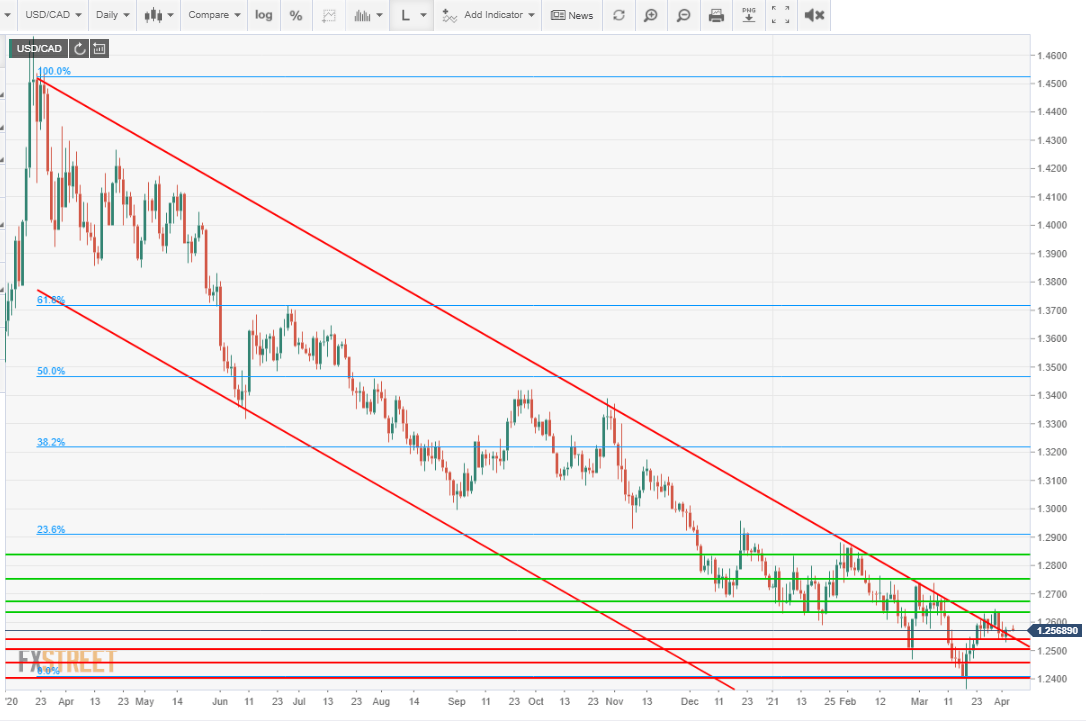
Given the technical dominance at the moment, or perhaps it is more accurate to say that the balanced fundamental forces leave the field to the analysts, the failure at 1.2635 and the re-entry of the descending channel should draw the USD/CAD lower.
The neutral Relative Strength Index at 49.43 is indicative of the overall state of the pair. The 21-day moving average (MV) at 1.2547 is part of support at 1.2540. The 100-day MV at 1.2725 is an additional weak line and the 200-day MV at 1.2997 is unimportant at the moment. The first Fibonacci at 23.6% at 1.2900 will be strong resistance when approached.
Resistance: 1.2635, 1.2675, 1.2750, 1.2835, 1.2900
Support: 1.2540, 1.2500, 1.2455, 1.2400.
USD/CAD Forecast Poll

The USD/CAD Forecast Poll depicts the paralysis in the pair. The immediate direction lower stems from the failure at 1.2635. The longer views reflect the lack of fundamental decision.
Premium
You have reached your limit of 3 free articles for this month.
Start your subscription and get access to all our original articles.
Author

Joseph Trevisani
FXStreet
Joseph Trevisani began his thirty-year career in the financial markets at Credit Suisse in New York and Singapore where he worked for 12 years as an interbank currency trader and trading desk manager.


