US Dollar Weekly Forecast: Data and Powell expected to dictate the mood
- US Dollar Index clinches its third consecutive weekly decline.
- The Federal Reserve delivered a jumbo rate cut on September 18.
- A soft landing of the US economy appears well on the cards.

Pessimism around the US Dollar (USD) persisted this week, driving the US Dollar Index (DXY) to new lows near 100.20 for the first time since summer 2023, marking its third consecutive weekly decline.
The weekly drop accelerated following the Federal Reserve's surprising 50 basis-point rate cut on Wednesday, defying expectations for a more conventional quarter-point reduction. Additionally, the Greenback’s decline was compounded by a resurgence in risk-on sentiment, fuelled by growing confidence in a soft landing for the US economy.
September’s price action highlights a strong resistance area just below the 102.00 level, with the broader bearish trend likely to continue as long as the DXY stays below the crucial 200-day Simple Moving Average (SMA) at 103.78.
Recession on the horizon: Fact or fiction?
Following the surprising rate cut in September, market participants are likely to shift their attention to assessing the US economy's performance to better gauge the likelihood of additional rate cuts.
A glimpse at last Wednesday’s event shows us that the Fed has made its first interest rate cut since 2020, implementing a larger-than-expected reduction. In fact, the Fed lowered its Fed Funds Target Range (FFTR) by 0.5 percentage points, bringing it to 4.75%-5.00% amidst what it deemed a “recalibration” to keep the economy up and running.
Additionally, the Committee’s projections suggested that rates could drop further before the end of the year.
Projections released after the meeting indicated that policymakers now expect inflation to decline more rapidly and unemployment to rise higher than previously anticipated.
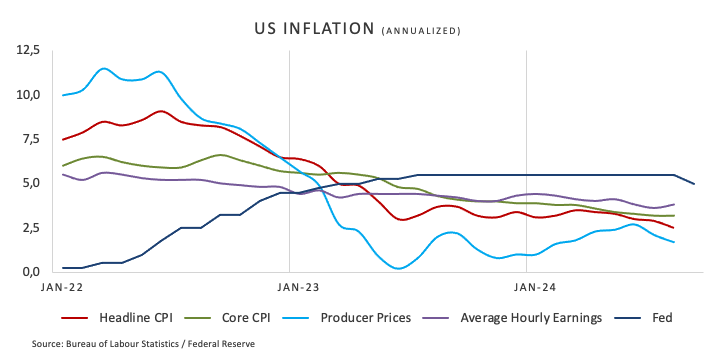
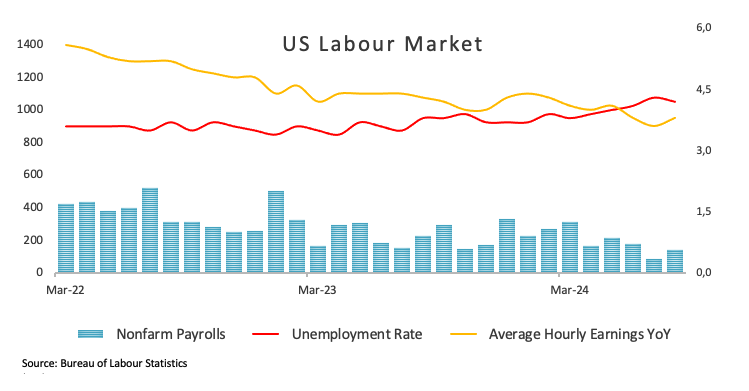
At his subsequent press conference, Chair Jerome Powell argued that he does not anticipate a recession or economic downturn in the near future due to solid growth, decreasing inflation, and a stable labour market. He suggested that the likelihood of a recession is not elevated.
In the wake of the FOMC event, investors have started to price in about 50 basis points of further easing for the remainder of the year. Although recession concerns have eased, upcoming economic data could still play a key role in shaping the Federal Reserve's monetary policy decisions in the months ahead.
According to the CME Group's FedWatch Tool, there is approximately a 62% probability of a quarter-point rate cut at the Fed's November 7 meeting, highlighting ongoing market expectations for further easing.
Monetary policies across the globe: What’s coming next?
The Eurozone, Japan, Switzerland, and the United Kingdom are grappling with increasing deflationary pressures, while the economic activity seems to have embarked on an erratic path. In response, the European Central Bank (ECB) executed its second interest rate cut earlier in the month and maintained a cautious outlook for potential moves in October. While ECB policymakers have not confirmed further reductions, markets are anticipating two additional cuts by the year's end.
Similarly, the Swiss National Bank (SNB) surprised markets with a 25-basis-point rate cut on June 20. The Bank of England (BoE) refrained from acting on rates earlier this week, maintaining its policy rate unchanged at 5.00% on the back of sticky inflation and still elevated prices in the services sector, all in combination with firm consumer spending and acceptable GDP data. Meanwhile, the Reserve Bank of Australia (RBA) opted to hold rates steady at its latest meeting while continuing to signal a hawkish stance in subsequent remarks. Furthermore, the central bank is seen keeping its OCR unchanged at its September 24 meeting, while market analysts expect the RBA to begin easing rates early in 2025. The Bank of Japan (BoJ) delivered a dovish hold at its gathering on September 20, while money markets predict only 25 basis points of further tightening over the next 12 months.
Economics in the political arena
Although Vice President Kamala Harris, the Democratic Party's presidential candidate, seems to have emerged as the winner of the recent debate against Republican candidate and former President Donald Trump, polls continue to indicate a close race ahead of the November 5 election.
Should Trump secure a victory, his administration may reintroduce tariffs, potentially disrupting or reversing the current disinflationary trend in the US economy and limiting the duration of Federal Reserve rate cuts.
Conversely, some analysts predict that a Harris administration could lead to higher taxes and possibly increase pressure on the Fed to ease monetary policy, particularly if economic growth shows signs of slowing.
What’s up next week?
After the pivotal FOMC event, market participants are expected to closely monitor the performance of the US economy going forward, focussing on the likelihood of additional interest rate cuts in the next few months. The week ahead will be notable for key releases, including inflation data from the Personal Consumption Expenditures (PCE) index and the Consumer Confidence report from the Conference Board. Additionally, preliminary PMI figures from the US and abroad are set to be released, along with the final estimate of Q2 GDP Growth Rate. Fed officials, including Chair Powell, are also scheduled to deliver a series of speeches, which will draw considerable attention.
Techs on the US Dollar Index
Since the US Dollar Index (DXY) broke below the key 200-day Simple Moving Average (SMA) at 103.78, it has posted gains in only one of the last six weeks.
The DXY now faces significant downward pressure, with a strong support level around the year-to-date (YTD) low of 100.21 (September 18). While an immediate break below this region seems unlikely, sporadic selling pressure could still occur. In that event, the 200-week SMA at 100.46 may provide initial support. However, a breach of the 2024 low could pave the way for a retracement towards the psychological 100.00 mark, potentially leading to a retest of the 2023 bottom of 99.57 (July 14).
On the upside, the index could see a short-term recovery. The first resistance would likely be the September high of 101.91 (September 3), followed by the provisional 55-day SMA at 102.66 and the weekly peak of 103.54 (August 8), with the 200-day SMA acting as a critical barrier once the latter is surpassed.
Notably, the Relative Strength Index (RSI) on the daily chart did not confirm the recent lows, suggesting the possibility of a short-term bounce. Additionally, the Average Directional Index (ADX) is near 41, indicating the current downtrend is moderately strong, though not yet extreme.
Economic Indicator
Personal Consumption Expenditures - Price Index (YoY)
The Personal Consumption Expenditures (PCE), released by the US Bureau of Economic Analysis on a monthly basis, measures the changes in the prices of goods and services purchased by consumers in the United States (US). The YoY reading compares prices in the reference month to a year earlier. Price changes may cause consumers to switch from buying one good to another and the PCE Deflator can account for such substitutions. This makes it the preferred measure of inflation for the Federal Reserve. Generally, a high reading is bullish for the US Dollar (USD), while a low reading is bearish.
Read more.Next release: Fri Sep 27, 2024 12:30
Frequency: Monthly
Consensus: -
Previous: 2.5%
Source: US Bureau of Economic Analysis
US Dollar PRICE Today
The table below shows the percentage change of US Dollar (USD) against listed major currencies today. US Dollar was the strongest against the Japanese Yen.
| USD | EUR | GBP | JPY | CAD | AUD | NZD | CHF | |
|---|---|---|---|---|---|---|---|---|
| USD | 0.00% | -0.21% | 0.96% | 0.02% | 0.09% | -0.02% | 0.37% | |
| EUR | -0.01% | -0.23% | 0.98% | -0.01% | 0.07% | -0.01% | 0.37% | |
| GBP | 0.21% | 0.23% | 1.23% | 0.24% | 0.31% | 0.22% | 0.62% | |
| JPY | -0.96% | -0.98% | -1.23% | -0.94% | -0.88% | -0.98% | -0.57% | |
| CAD | -0.02% | 0.01% | -0.24% | 0.94% | 0.06% | -0.02% | 0.38% | |
| AUD | -0.09% | -0.07% | -0.31% | 0.88% | -0.06% | -0.07% | 0.33% | |
| NZD | 0.02% | 0.01% | -0.22% | 0.98% | 0.02% | 0.07% | 0.40% | |
| CHF | -0.37% | -0.37% | -0.62% | 0.57% | -0.38% | -0.33% | -0.40% |
The heat map shows percentage changes of major currencies against each other. The base currency is picked from the left column, while the quote currency is picked from the top row. For example, if you pick the US Dollar from the left column and move along the horizontal line to the Japanese Yen, the percentage change displayed in the box will represent USD (base)/JPY (quote).
Author

Pablo Piovano
FXStreet
Born and bred in Argentina, Pablo has been carrying on with his passion for FX markets and trading since his first college years.

















