- The USD Index (DXY) closed another week of gains.
- The Department of Labor (DoL) revised the December CPI.
- Investors see the Fed cutting its interest rates in May.
- Markets’ attention now shifts to the US CPI in January.
Despite Friday’s inconclusive price action, the Greenback managed to print its fourth consecutive week in the positive territory, including a new yearly high past the 104.00 barrier when measured by the USD Index (DXY).
The weekly positive performance of the US Dollar (USD) was underpinned by shrinking bets of a potential start of the Federal Reserve’s (Fed) easing cycle in March, favouring instead a move in May or even June.
According to CME Group’s FedWatch Tool, the probability of an interest rate reduction at the May 1 gathering approaches 52%, from around 40% a month ago.
While there were no significant data releases from key fundamentals this week, the increasingly solid perception that the US economy will reach a “soft landing” continued to support the Dollar. Regarding domestic results, it is worth noting that the Department of Labor (DoL) revised the monthly December inflation figures, reporting that the headline CPI rose 0.2% instead of the previous 0.3% estimate and Core CPI rose 3.3% in the last three months of 2023, matching previous figures, according to BNN Bloomberg.
Meanwhile, the current resilience of the US economy bolstered the latest comments from Federal Reserve Chair Jerome Powell after he almost completely discarded a rate cut in March, at the time when he suggested that more confidence is needed to embark on a new easing cycle.
Backing the aforementioned points, Minneapolis Fed President Neel Kashkari proposed on Wednesday that the Committee should deliberate thoroughly on data before deciding on rate reductions, hinting that it might be suitable to consider two to three rate cuts within the year. Meanwhile, Richmond Fed President Thomas Barkin indicated on Thursday that forthcoming inflation indicators are expected to be positive.
Earlier in the week, Boston Fed President Susan Collins advocated for rate reductions later in the year in case the economy meets expectations. She added that upcoming rate cuts should be gradual and methodical. Collins also hinted at the possibility that future interest rates might be higher than those seen before the pandemic.
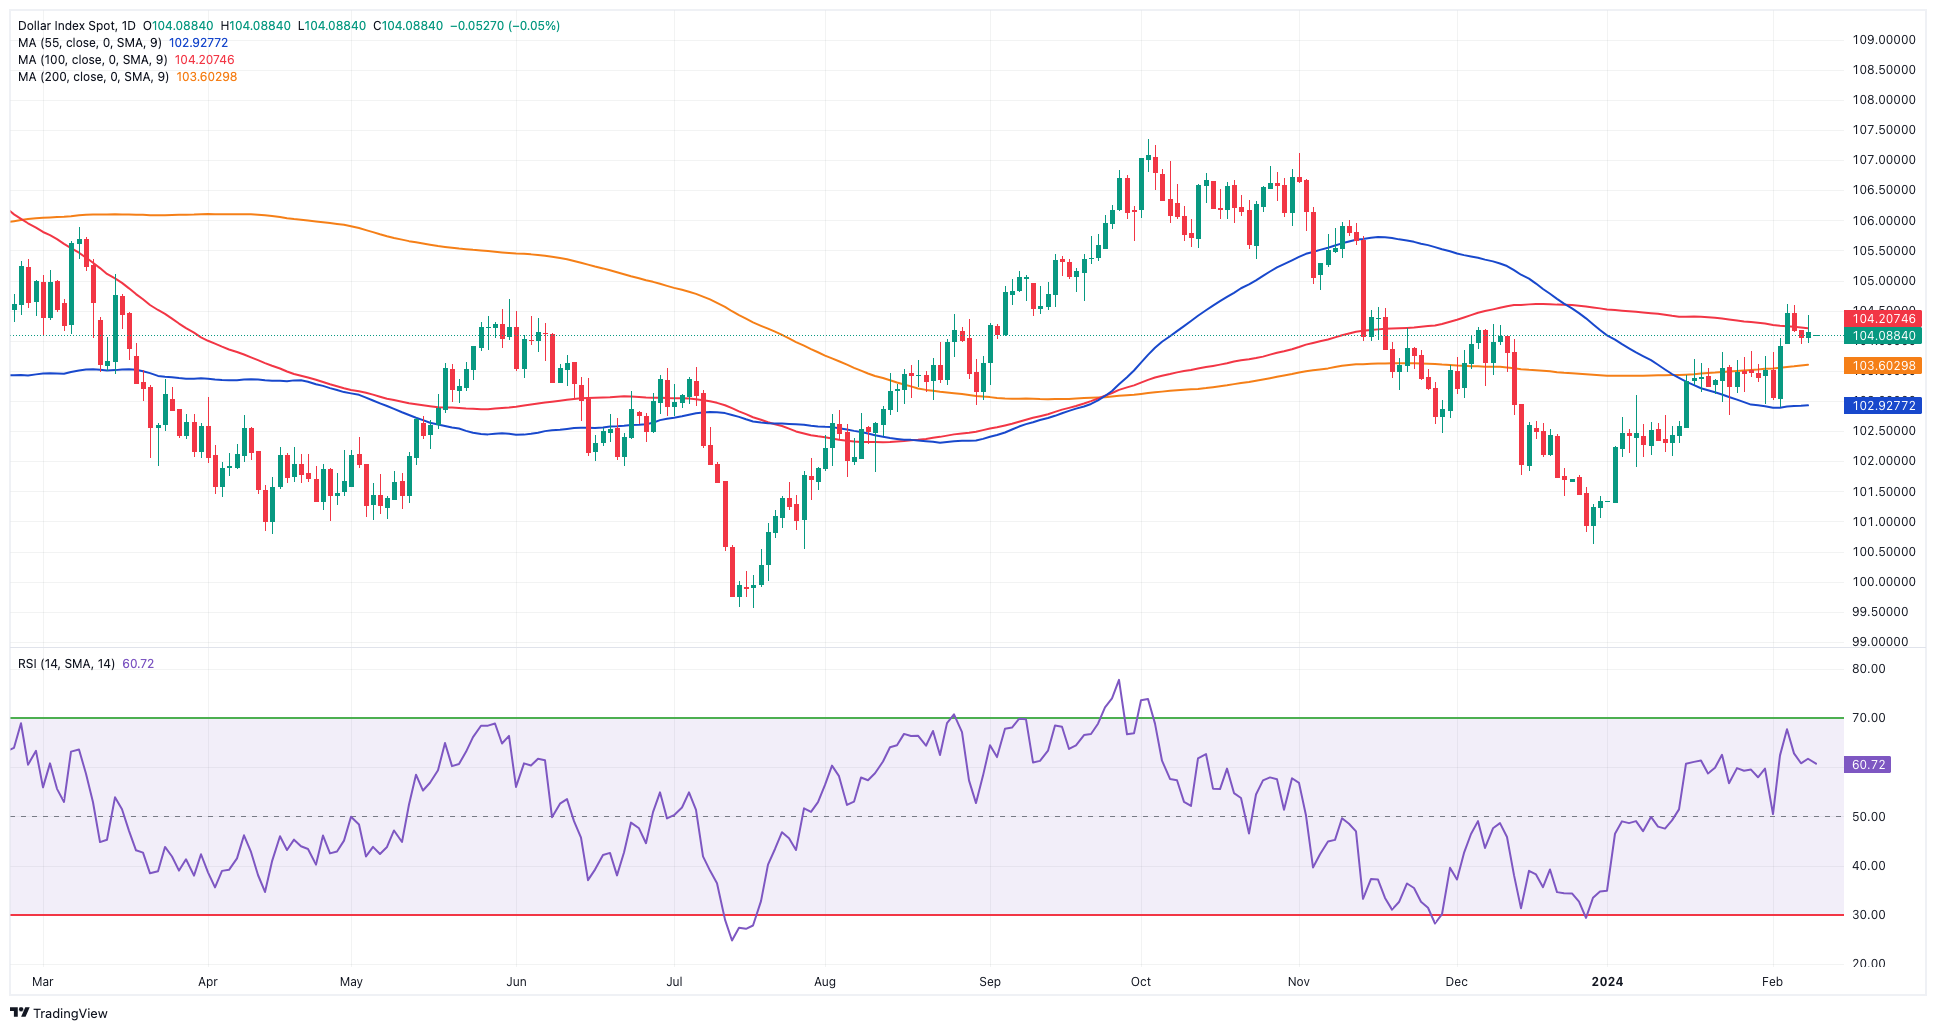
DXY Technical Outlook
The daily chart of the DXY index shows that immediate resistance is likely around the 2024 high of 104.60 (February 5). Further up comes a minor hurdle at the weekly top of 106.00 (November 10) prior to the November peak of 107.11 (November 1).
However, if sellers take control, there is first support at the 200-day SMA of 103.61 ahead of the provisional 55-day SMA at 103.02 and the weekly low of 102.77 set on January 24. The breach of this level should see no significant support zone until the December low of 100.61 (December 28) before the psychological 100.00 barrier and the 2023 low of 99.57 (July 14).
US Dollar price this week
The table below shows the percentage change of US Dollar (USD) against listed major currencies this week. US Dollar was the strongest against the Swiss Franc.
| USD | EUR | GBP | CAD | AUD | JPY | NZD | CHF | |
| USD | -0.04% | -0.08% | -0.08% | -0.22% | 0.54% | -1.33% | 0.94% | |
| EUR | 0.05% | -0.04% | -0.04% | -0.19% | 0.59% | -1.29% | 0.97% | |
| GBP | 0.08% | 0.04% | 0.00% | -0.15% | 0.62% | -1.24% | 1.01% | |
| CAD | 0.09% | 0.05% | 0.00% | -0.13% | 0.62% | -1.24% | 1.02% | |
| AUD | 0.23% | 0.20% | 0.15% | 0.15% | 0.77% | -1.09% | 1.16% | |
| JPY | -0.55% | -0.59% | -0.64% | -0.62% | -0.75% | -1.87% | 0.38% | |
| NZD | 1.31% | 1.27% | 1.23% | 1.23% | 1.09% | 1.84% | 2.24% | |
| CHF | -0.93% | -0.97% | -1.02% | -1.02% | -1.15% | -0.39% | -2.28% |
The heat map shows percentage changes of major currencies against each other. The base currency is picked from the left column, while the quote currency is picked from the top row. For example, if you pick the Euro from the left column and move along the horizontal line to the Japanese Yen, the percentage change displayed in the box will represent EUR (base)/JPY (quote).
(This story was corrected on February 12 at 11:50 GMT to say that there is first support at the 200-day SMA of 103.61, not the first resistance.)
Economic Indicator
United States Consumer Price Index (YoY)
Inflationary or deflationary tendencies are measured by periodically summing the prices of a basket of representative goods and services and presenting the data as The Consumer Price Index (CPI). CPI data is compiled on a monthly basis and released by the US Department of Labor Statistics. The YoY reading compares the prices of goods in the reference month to the same month a year earlier.The CPI is a key indicator to measure inflation and changes in purchasing trends. Generally speaking, a high reading is seen as bullish for the US Dollar (USD), while a low reading is seen as bearish.
Read more.Why it matters to traders
The US Federal Reserve has a dual mandate of maintaining price stability and maximum employment. According to such mandate, inflation should be at around 2% YoY and has become the weakest pillar of the central bank’s directive ever since the world suffered a pandemic, which extends to these days. Price pressures keep rising amid supply-chain issues and bottlenecks, with the Consumer Price Index (CPI) hanging at multi-decade highs. The Fed has already taken measures to tame inflation and is expected to maintain an aggressive stance in the foreseeable future.
Information on these pages contains forward-looking statements that involve risks and uncertainties. Markets and instruments profiled on this page are for informational purposes only and should not in any way come across as a recommendation to buy or sell in these assets. You should do your own thorough research before making any investment decisions. FXStreet does not in any way guarantee that this information is free from mistakes, errors, or material misstatements. It also does not guarantee that this information is of a timely nature. Investing in Open Markets involves a great deal of risk, including the loss of all or a portion of your investment, as well as emotional distress. All risks, losses and costs associated with investing, including total loss of principal, are your responsibility. The views and opinions expressed in this article are those of the authors and do not necessarily reflect the official policy or position of FXStreet nor its advertisers. The author will not be held responsible for information that is found at the end of links posted on this page.
If not otherwise explicitly mentioned in the body of the article, at the time of writing, the author has no position in any stock mentioned in this article and no business relationship with any company mentioned. The author has not received compensation for writing this article, other than from FXStreet.
FXStreet and the author do not provide personalized recommendations. The author makes no representations as to the accuracy, completeness, or suitability of this information. FXStreet and the author will not be liable for any errors, omissions or any losses, injuries or damages arising from this information and its display or use. Errors and omissions excepted.
The author and FXStreet are not registered investment advisors and nothing in this article is intended to be investment advice.
Recommended Content
Editors’ Picks
EUR/USD stays in positive territory above 1.0850 after US data

EUR/USD clings to modest daily gains above 1.0850 in the second half of the day on Friday. The improving risk mood makes it difficult for the US Dollar to hold its ground after PCE inflation data, helping the pair edge higher ahead of the weekend.
GBP/USD stabilizes above 1.2850 as risk mood improves

GBP/USD maintains recovery momentum and fluctuates above 1.2850 in the American session on Friday. The positive shift seen in risk mood doesn't allow the US Dollar to preserve its strength and supports the pair.
Gold rebounds above $2,380 as US yields stretch lower

Following a quiet European session, Gold gathers bullish momentum and trades decisively higher on the day above $2,380. The benchmark 10-year US Treasury bond yield loses more than 1% on the day after US PCE inflation data, fuelling XAU/USD's upside.
Avalanche price sets for a rally following retest of key support level

Avalanche (AVAX) price bounced off the $26.34 support level to trade at $27.95 as of Friday. Growing on-chain development activity indicates a potential bullish move in the coming days.
The election, Trump's Dollar policy, and the future of the Yen

After an assassination attempt on former President Donald Trump and drop out of President Biden, Kamala Harris has been endorsed as the Democratic candidate to compete against Trump in the upcoming November US presidential election.