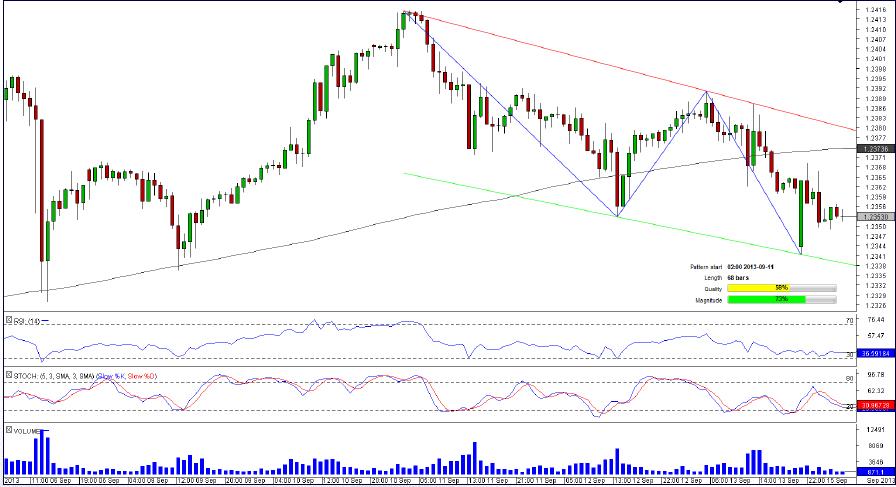
EUR/CHF 1H Chart: Channel Down
Comment: A rise to a one-month high of 1.2415 on September 11 incited a sharp depreciation of the pair that has been vacillating between two downward-sloping lines thus forming a channel down pattern. After bouncing off a one-week low of 1.2341 on September 13, EUR/CHF neared its daily support region at 1.2351, and traders expect the pair to advance further (61% of market players bet on an appreciation of EUR/CHF). On the other hand, the potential for the downside also remains strong, given a recent death cross of short-and long-term SMAs as well as bearishness of the pattern.
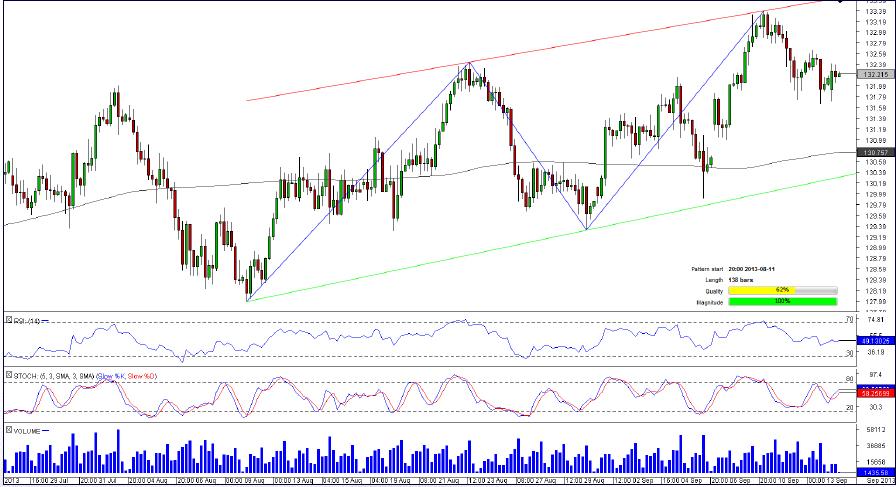
EUR/JPY 4H Chart: Channel Up
Comment: After tumbling to a one-month low of 127.97 on August 11, the currency couple commenced to form a channel up pattern that took the pair to a four-month high of 133.41 touched on September 10. Having reached this high, EUR/JPY retreated slightly to trade at its daily pivot point at 132.15 sitting right above the 50-bar SMA. The pair is likely to use its daily pivot point as a prop for an advance to the four-hour resistance zone at 132.34/53 (four-hour R1, R2). A breach through this region may enfeeble the pair, but EUR/JPY may still retain some strength to attempt to overcome the daily resistance at 132.63 (daily R1) that is the last defence against a sharp appreciation of the pair.
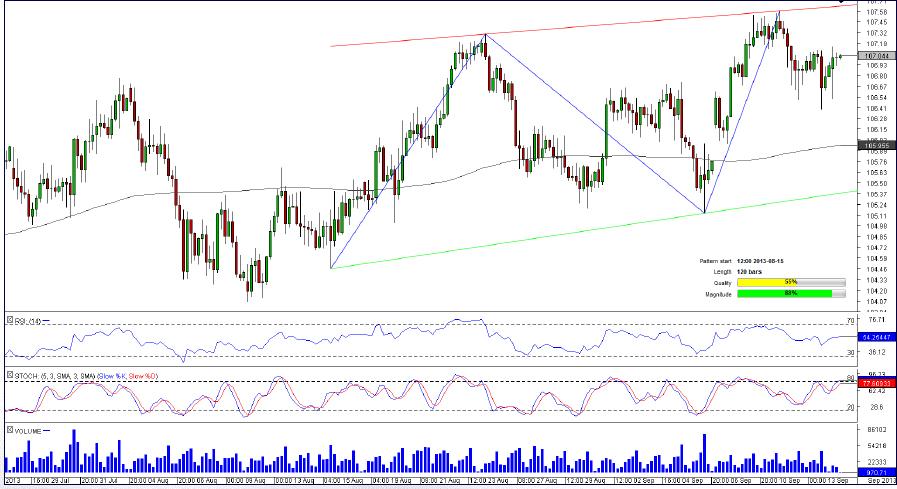
CHF/JPY 4H Chart: Channel Up
Comment: CHF/JPY has been gradually appreciating since August 15, when the pair started to shape a channel up pattern. On September 11, the currency couple hit a five-month high of 107.59 that alleviated a buying pressure and forced the pair to descend to the four-hour pivot point at 107.00. Market players are strongly bullish on the pair, with 85.71% of all orders are placed to buy CHF/JPY. If traders’ outlook materializes, the pair will break two important resistance lines lying at 107.09/10 to attain the daily resistance at 107.21. The pair may try to overcome this formidable region to prolong its rally towards the next pitfall at 107.51 (daily R2).
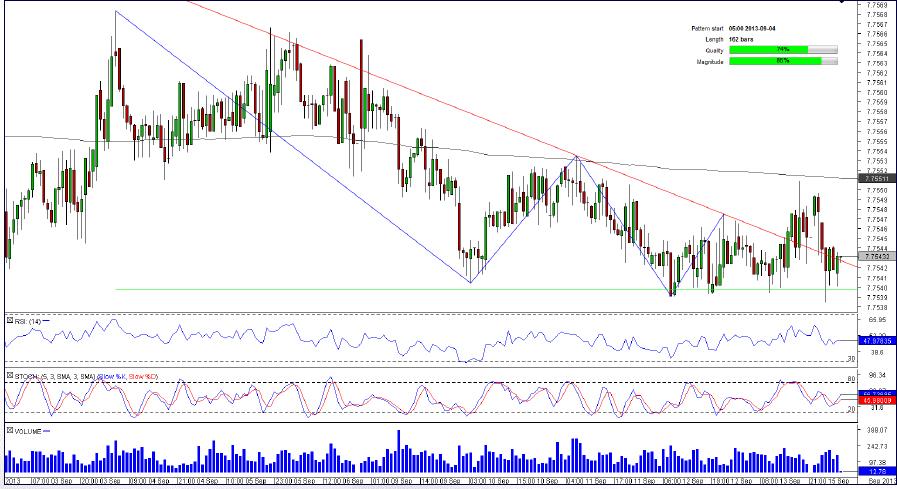
USD/HKD 1H Chart: Descending Triangle
Comment: Despite breaking out from the descending triangle pattern on September 13, USD/HKD did not manage to consolidate above the upper-limit of the pattern and dived below it to trade near 50-hour SMA at 7.7534. The pair is expected is to appreciate in the days to come, given that traders are bullish on the currency couple in 83.33% of cases. To confirm this, USD/HKD has to overcome a strong selling pressure coming from the upper-boundary of the pattern and move to the daily pivot point at 7.7545 that represents the next constraint for an upward move. If the pair breaches this level, it is likely to approach its 200-hour SMA at 7.7551, the level which may thwart a climb of the pair.
This overview can be used only for informational purposes. Dukascopy SA is not responsible for any losses arising from any investment based on any recommendation, forecast or other information herein contained.
Recommended Content
Editors’ Picks
AUD/USD: Uptrend remains capped by 0.6650

AUD/USD could not sustain the multi-session march north and faltered once again ahead of the 0.6650 region on the back of the strong rebound in the Greenback and the prevailing risk-off mood.
EUR/USD meets a tough barrier around 1.0800

The resurgence of the bid bias in the Greenback weighed on the risk-linked assets and motivated EUR/USD to retreat to the 1.0750 region after another failed attempt to retest the 1.0800 zone.
Gold eases toward $2,310 amid a better market mood

After falling to $2,310 in the early European session, Gold recovered to the $2,310 area in the second half of the day. The benchmark 10-year US Treasury bond yield stays in negative territory below 4.5% and helps XAU/USD find support.
Bitcoin price coils up for 20% climb, Standard Chartered forecasts more gains for BTC

Bitcoin (BTC) price remains devoid of directional bias, trading sideways as part of a horizontal chop. However, this may be short-lived as BTC price action consolidates in a bullish reversal pattern on the one-day time frame.
What does stagflation mean for commodity prices?

What a difference a quarter makes. The Federal Reserve rang in 2024 with a bout of optimism that inflation was coming down to their 2% target. But that optimism has now evaporated as the reality of stickier-than-expected inflation becomes more evident.


