To boldly go [Video]
![To boldly go [Video]](https://editorial.fxstreet.com/images/Markets/Currencies/Majors/DollarIndex/rows-of-dollars-bundles-background-19722556_XtraLarge.jpg)
US Dollar: Dec '21 USD is Down at 93.790.
Energies: Nov '21 Crude is Up at 81.40.
Financials: The Dec '21 30 Year bond is Up 1 tick and trading at 159.22.
Indices: The Dec '21 S&P 500 emini ES contract is 122 ticks Higher and trading at 4385.50.
Gold: The Dec'21 Gold contract is trading Up at 1798.20. Gold is 35 ticks Higher than its close.
Initial conclusion
This is not a correlated market. The dollar is Down and Crude is Up which is normal but the 30 year Bond is trading Higher. The Financials should always correlate with the US dollar such that if the dollar is lower then bonds should follow and vice-versa. The S&P is Higher and Crude is trading Higher which is not correlated. Gold is trading Higher which is correlated with the US dollar trading Down. I tend to believe that Gold has an inverse relationship with the US Dollar as when the US Dollar is down, Gold tends to rise in value and vice-versa. Think of it as a seesaw, when one is up the other should be down. I point this out to you to make you aware that when we don't have a correlated market, it means something is wrong. As traders you need to be aware of this and proceed with your eyes wide open. Currently Asia is trading Mixed with half the exchanges Higher and the other half Lower. All of Europe is trading Higher at this time.
Possible challenges to traders today
-
PPI is out at 8:30 AM EST. This is Major.
-
Core PPI is out at 8:30 AM EST. This is Major.
-
Unemployment Claims is out at 8:30 AM EST. This is Major.
-
FOMC Member Bostic Speaks at 10 AM EST. This is Major.
-
Natural Gas Storage is out at 10:30 AM EST. This is Major.
-
Crude Oil Inventories are out at 11 AM EST. This is Major.
-
FOMC Member Barkin Speaks at 1 PM EST. This is Major.
Treasuries
Traders please note that we've changed the Bond instrument from the 30 year (ZB) to the 10 year (ZN). They work exactly the same.
We've elected to switch gears a bit and show correlation between the 10 year bond (ZN) and The S&P futures contract. The S&P contract is the Standard and Poor's and the purpose is to show reverse correlation between the two instruments. Remember it's liken to a seesaw, when up goes up the other should go down and vice versa.
Yesterday the ZN made it's move at around 8:40 AM EST. The ZN hit a Low at around that time and the S&P moved Lower. If you look at the charts below ZN gave a signal at around 8:40 AM EST and the S&P moved Lower at around the same time. Look at the charts below and you'll see a pattern for both assets. ZN hit a Low at around 8:40 AM EST and the S&P was moving Lower shortly thereafter. These charts represent the newest version of MultiCharts and I've changed the timeframe to a 15 minute chart to display better. This represented a Long opportunity on the 10 year note, as a trader you could have netted about 20 ticks per contract on this trade. Each tick is worth $15.625. Please note: the front month for the ZN is now Dec '21. The S&P contract is now Dec '21 as well. I've changed the format to Renko bars such that it may be more apparent and visible.
Charts courtesy of MultiCharts built on an AMP platform
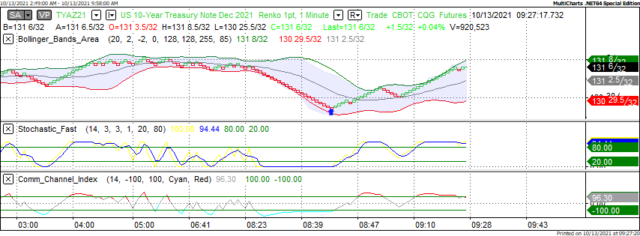
ZN - Dec 2021 - 10/13/21
-637698031280159183.png)
S&P - Dec 2021 - 10/13/21
Bias
Yesterday we gave the markets a Neutral bias as we didn't see any semblance of correlation Wednesday morning. The Dow closed Lower by about half a point, but the other exchanges traded slightly Higher. All in all a Neutral or Mixed day. Today we aren't dealing with a correlated market and our bias is Neutral.
Could this change? Of Course. Remember anything can happen in a volatile market.
Commentary
A funny thing happened yesterday as the markets opened they migrated Lower until 10 AM EST. What happened at that time? Actor William Shatner who portraited Captain Kirk of Star Trek fame finally rode into space at the age of 90. William Shatner is the oldest man ever to attempt a voyage into the Final Frontier and couldn't say enough about it. At the age of 90 he sounded like a teenager. After 10 AM EST the Dow migrated Higher and didn't look back. Coincidence? Maybe or perhaps this awakens the idealism in all of us.
Author

Nick Mastrandrea
Market Tea Leaves


