The US inflation rate fluctuated throughout history

Introduction
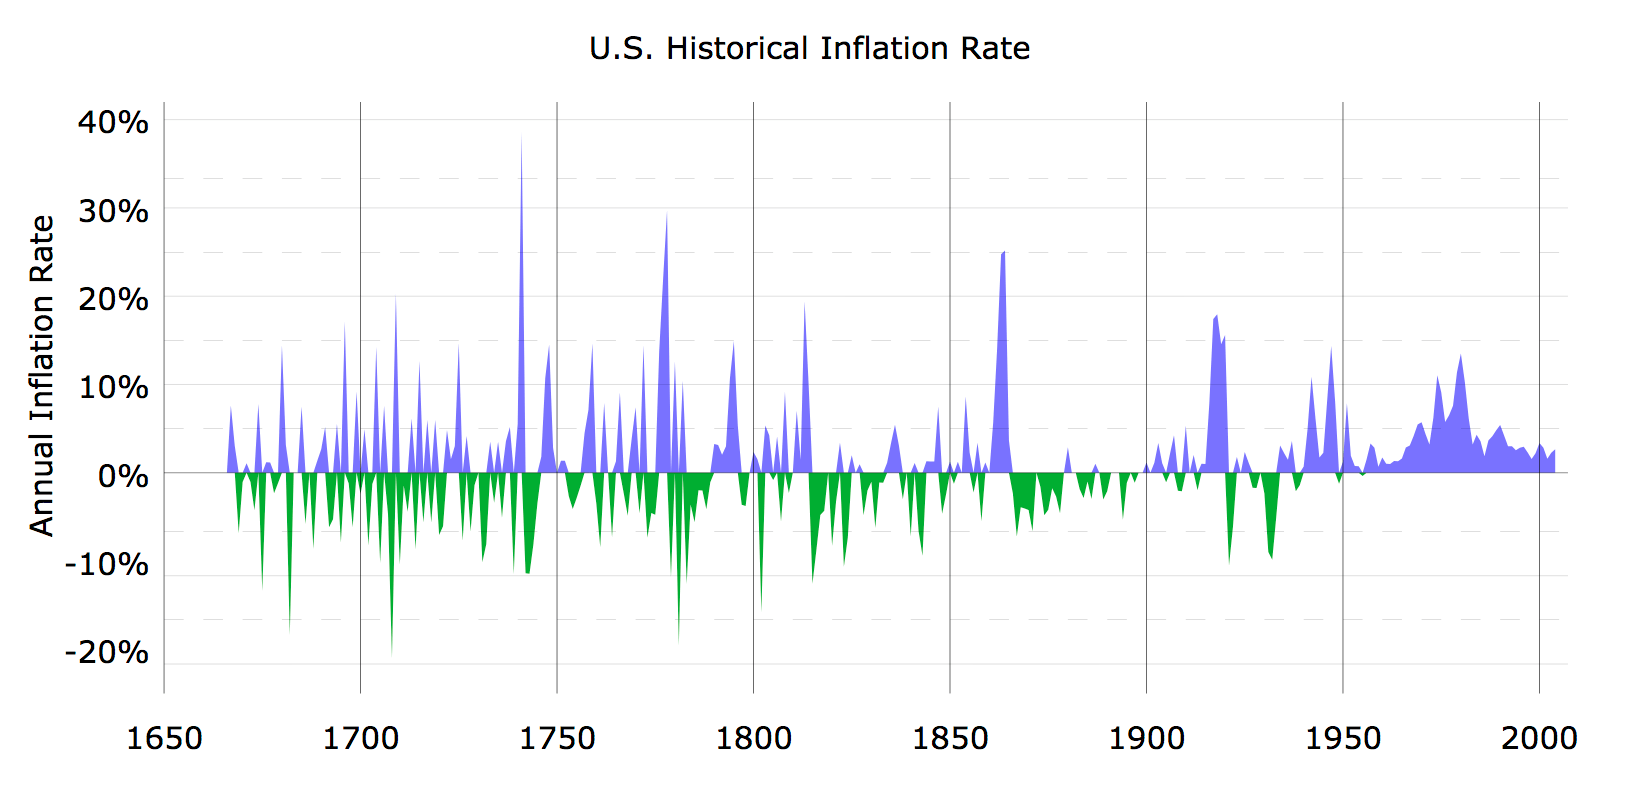
The US inflation rate fluctuated throughout history. There have been all kind of inflation regimes. Periods of high, low, and negative inflation were recorded. The first chart gives a good overview of the historic inflation evolution in the US. It shows the frequent and sharp spikes of inflation and deflation during the early history of the US. The spikes became less volatile during the second half of the 19th century. The third obviously visible regime is the period from 1970 until today. Some moderate level of inflation persisted throughout this period.
There is widespread belief among investors that gold is a well performing asset in periods of high inflation. We will analyse the performance of gold during periods of high inflation in the past couple of centuries.
Inflation History & Gold Performance
We are utilising a dataset from Lawrence H. Officer and Samuel H. Williamson, MeasuringWorth 2018. Their inflation and gold price data goes back to 1790. We are specifically looking for periods with elevated inflation. Our bespoke definition of “elevated inflation” is a change of more than 5% in the consumer price index (CPI). The dataset reveals a total of 39 years that recorded more than 5% inflation in the United States since 1790. We measure the performance of gold during the respective elevated inflation years in real terms. Hence, we adjust nominal gold performance for inflation.

Our results do not confirm the widespread belief that gold performs well during inflationary periods. The average performance has been -8% and -1% in real terms expressed by median and mean respectively. The histogram shows the distribution of returns graphically. It was overwhelmingly negative with regard to frequency. Descriptive statistics confirm the picture. They reveal that the 25th and 75th percentiles are both negative and amount to -2% and -14% respectively. That means that the big junk of the gold returns distribution during inflationary periods is negative. This becomes visible by looking at the bar chart, which displays real returns for gold p.a. during periods that recorded more than 5% inflation. An outperformance of gold relative to cash occurred if gold returned more than -5% in a respective year. Our results show that gold outperformed cash only in 13 out of 39 years inflationary periods. Most often, gold underperformed cash during elevated inflation periods historically. The precious metal has not been a reliable hedge during inflationary periods.

Golden Decade
It is especially noteworthy that gold increased sharply during the 1970s. The gold run during that decade has been unmatched throughout our long-term dataset. Gold increased more than fifteen fold from 1970 to 1980. Its price appreciation during that decade is greater than all of gold’s price increase during the preceding couple of centuries combined. The long term evolution of the gold price is depicted in our final chart. It is a logarithmic chart, which shows clearly when gold recorded the vast majority of it’s gains.

As a result, gold’s performance during elevated inflation years results in a much weaker picture if we exclude the 10 year period between 1970 to 1980. Real gold performance decreases to a mean and median return of -10% and -9% respectively if we isolate the “golden decade”.
There is something that stands out for the golden decade. It has been the longest inflationary (according to our bespoke definition) period in our dataset if we account for inflationary years surrounding it. There were other time windows, which recorded higher inflation levels over all. However, there were none lasting longer. After all, this may imply that gold could be a good inflation hedge in a very special case. The special case being that market participants need to face and adapt to inflation for an extended period of time.
Conclusion
It is a myth that gold performs well during inflationary periods. Evidence points to a very different picture. In general, gold has performed negatively during periods of elevated inflation. Most of the time, it was outperformed by cash.
An exception to this conclusion could be longer periods of elevated inflation. Gold could be a good inflation hedge during such periods after all. However, there are not enough observations regarding extended inflation periods in order to apply our statistical methods.
All in all, gold has not been a reliable hedge against inflation. The relationship between both appears to be more complex than a simple CPI up means gold up.
Interested in more of our ideas? Check out Scienceinvesting for more details!
Interested in more of our ideas? Check out Scienceinvesting for more details!
Author

Science Investing Team
Science Investing


