The Trend Trader helps to identify the current trend status of your favorite ETF markets. It not only helps us to stay on the right side of market direction, but also helps us avoid those without a trend. You can even use the grid as a spread matrix too - buying strength and selling weakness.
Pivot Point analysis is merely a tool and should be used with other technical indicators. It can be used to enter a trade, or exit a trade and when combined with average true range is a powerful money management tool. Once you enter a trade, you are no longer a trader, you are a risk manager and should monitor your trades on a weekly or daily basis depending on volatility. When you enter a trade assume you are wrong and let the market prove you are right. This will diminish the hubris and arrogance that is common to many traders. Please use these Pivot Points as a guide to better trading.
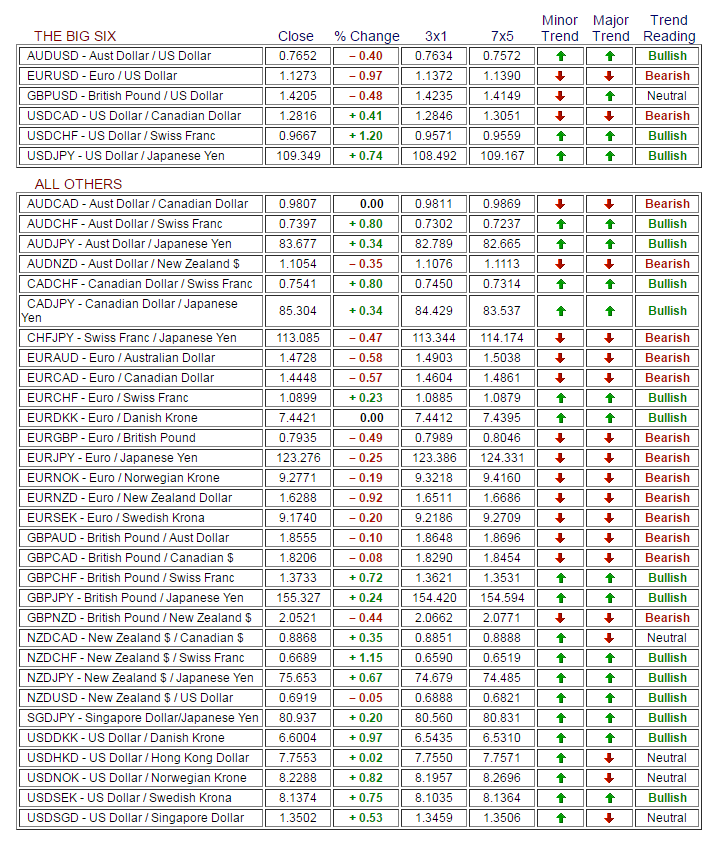
As you examine the work sheet, please note where there are two arrows confirming a trend. Be it long or short, a close must occur above or below two trend arrows to confirm a strong trend.
The short term trend is a three day moving average of the Daily Pivot. The long term trend is the Weekly Pivot. So we are comparing a short term moving average with a long term simple weekly average.
Remember, the 3x1 is a moving average of the Daily Pivot. If you are daytrading and the price of your commodity or financial instrument trades through the 3x1, you may want to stop and reverse.
Rules:
Price > than 3x1 and 7x5...Buy
Price < than 3x1and 7x5... Sell
Price > above 3x1 but < 7x5...minor buy
Price < below 3x1 but > 7x5...minor sell.
If you choose to ignore these guidelines, you will be a counter trend trader. There is usually more risk associated with trading against the trend.
You can use the grid as a spread matrix too - buying strength and selling weakness.
Pattern Trapper reports are compiled from sources believed to be reliable, but their accuracy cannot be guaranteed. There is substantial risk of loss in futures trading. There is no warranty, express or implied, in regards to the fitness of this information for any particular purpose. Past performance is not a guarantee of future results. All materials are copyright © 2009 by Bob Hunt. No part of these resources may be reproduced, stored or transmitted without the prior written permission of the copyright holder.
Recommended Content
Editors’ Picks
AUD/USD trades with mild positive bias near 0.6700, RBA Meeting Minutes eyed

The AUD/USD trades with a mild positive bias near 0.6695 during the early Asian session on Monday. The weaker US Dollar provides some support to the pair. The markets remain unconvinced that the Fed will pivot earlier than previously expected.
EUR/USD gains ground above 1.0850, focus on Fedspeak

The EUR/USD pair trades on a stronger note around 1.0875 on Monday during the early Asian trading hours. The uptick in the major pair is bolstered by the softer Greenback. The Federal Reserve’s Bostic, Barr, Waller, Jefferson, and Mester are scheduled to speak on Monday.
Gold gains ground above $2,400, eyes on Fedspeak

Gold price gathers strength around $2,415 during the early Asian session on Monday. The softer US inflation data in April provides some support to the yellow metal. Meanwhile, the USD Index edges lower to 104.50, losing 0.03% on the day.
AI tokens could really ahead of Nvidia earnings

Native cryptocurrencies of several blockchain projects using Artificial Intelligence could register gains in the coming week as the market prepares for NVIDIA earnings report.
Week ahead: Flash PMIs, UK and Japan CPIs in focus. RBNZ to hold rates

After cool US CPI, attention shifts to UK and Japanese inflation. Flash PMIs will be watched too amid signs of a rebound in Europe. Fed to stay in the spotlight as plethora of speakers, minutes on tap.