The Trend Trader helps to identify the current trend status of your favorite ETF markets. It not only helps us to stay on the right side of market direction, but also helps us avoid those without a trend. You can even use the grid as a spread matrix too - buying strength and selling weakness.
Pivot Point analysis is merely a tool and should be used with other technical indicators. It can be used to enter a trade, or exit a trade and when combined with average true range is a powerful money management tool. Once you enter a trade, you are no longer a trader, you are a risk manager and should monitor your trades on a weekly or daily basis depending on volatility. When you enter a trade assume you are wrong and let the market prove you are right. This will diminish the hubris and arrogance that is common to many traders. Please use these Pivot Points as a guide to better trading.
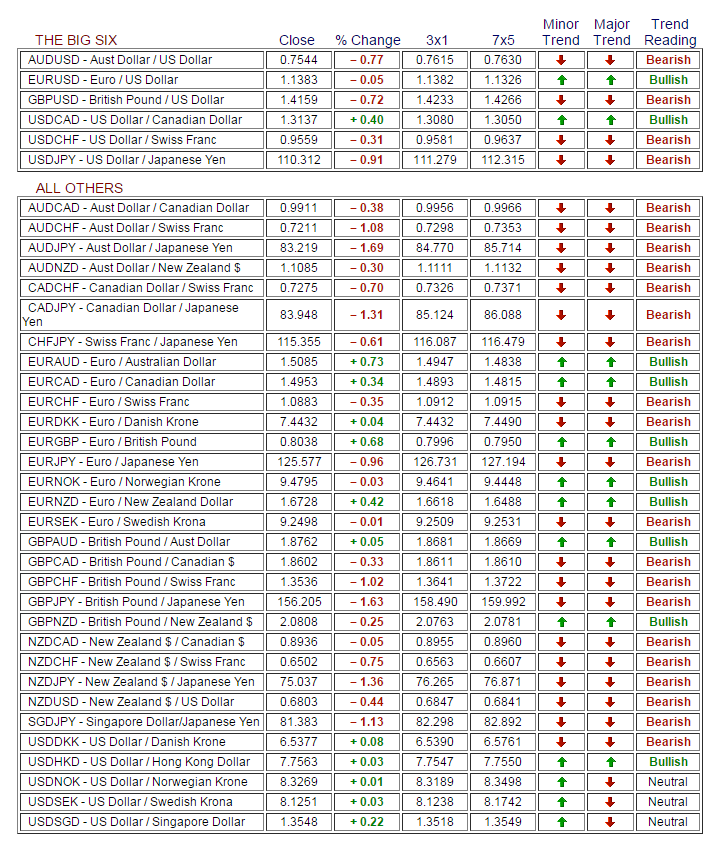
As you examine the work sheet, please note where there are two arrows confirming a trend. Be it long or short, a close must occur above or below two trend arrows to confirm a strong trend.
The short term trend is a three day moving average of the Daily Pivot. The long term trend is the Weekly Pivot. So we are comparing a short term moving average with a long term simple weekly average.
Remember, the 3x1 is a moving average of the Daily Pivot. If you are daytrading and the price of your commodity or financial instrument trades through the 3x1, you may want to stop and reverse.
Rules:
Price > than 3x1 and 7x5...Buy
Price < than 3x1and 7x5... Sell
Price > above 3x1 but < 7x5...minor buy
Price < below 3x1 but > 7x5...minor sell.
If you choose to ignore these guidelines, you will be a counter trend trader. There is usually more risk associated with trading against the trend.
You can use the grid as a spread matrix too - buying strength and selling weakness.
Pattern Trapper reports are compiled from sources believed to be reliable, but their accuracy cannot be guaranteed. There is substantial risk of loss in futures trading. There is no warranty, express or implied, in regards to the fitness of this information for any particular purpose. Past performance is not a guarantee of future results. All materials are copyright © 2009 by Bob Hunt. No part of these resources may be reproduced, stored or transmitted without the prior written permission of the copyright holder.
Recommended Content
Editors’ Picks
AUD/USD: Uptrend remains capped by 0.6650

AUD/USD could not sustain the multi-session march north and faltered once again ahead of the 0.6650 region on the back of the strong rebound in the Greenback and the prevailing risk-off mood.
EUR/USD meets a tough barrier around 1.0800

The resurgence of the bid bias in the Greenback weighed on the risk-linked assets and motivated EUR/USD to retreat to the 1.0750 region after another failed attempt to retest the 1.0800 zone.
Gold eases toward $2,310 amid a better market mood

After falling to $2,310 in the early European session, Gold recovered to the $2,310 area in the second half of the day. The benchmark 10-year US Treasury bond yield stays in negative territory below 4.5% and helps XAU/USD find support.
Bitcoin price coils up for 20% climb, Standard Chartered forecasts more gains for BTC

Bitcoin (BTC) price remains devoid of directional bias, trading sideways as part of a horizontal chop. However, this may be short-lived as BTC price action consolidates in a bullish reversal pattern on the one-day time frame.
What does stagflation mean for commodity prices?

What a difference a quarter makes. The Federal Reserve rang in 2024 with a bout of optimism that inflation was coming down to their 2% target. But that optimism has now evaporated as the reality of stickier-than-expected inflation becomes more evident.