The major indices, following a large opening rally, which quickly faded, finished slightly lower

Recap 9/27 - The S&P opened with a 20 handle gap up and then traded another 41 handles higher into an 9:41 AM high of the day. From that high, the S&P declined 94 handles into a 1:56 PM low of the day. From that low, the S&P rallied 33 handles into a 3:56 PM high.From that high, the S&P declined 5 handles into the close.
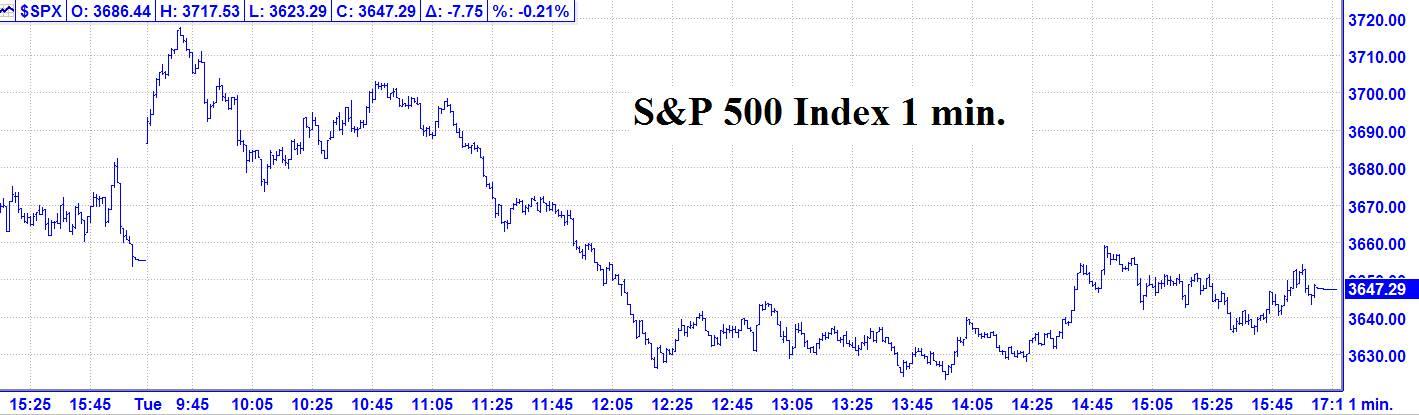
9/27 – The major indices, following a large opening rally, which quickly faded, finished slightly lower to mixed with the following closes: DJIA – 125.82; S&P 500 – 7.75; and the Nasdaq Comp. + 26.58.
Review & Looking ahead – Good news, bad news, Tuesday, the S&P etched a 61 handle rally in the first 11 minutes and that was it. Normally, a 61 handle rally would be considered a good up day. We have now had two change in trend windows where the market had a weak day leading into the window and then had a strong opening the next day. From a psychological point of view, this is an indication that the sheep are aggressively looking for a reversal, which usually leads to a failed pattern.
Looking ahead – We are now at the end of our 9/27 AC change in trend window. Overnight, the S&P futures are testing Tuesday’s low. We would like to see a lower opening and then a reversal to the upside in the first hour. If the market is making new lows after the first hour, stand aside. Our next change in trend window is 9/28 AC. BTW, Tuesday was the sixth consecutive down day for the S&P 500. The market seldom goes more than six consecutive days in one direction.
Please see details below.
The Now Index has moved back to the BUY ALERT ZONE. This is a cautionary indication that there is a moderate imbalance of too many short.
This is not an outright buy signal.
Coming events
(Stocks potentially respond to all events).
B. 9/28 AC – Jupiter 45 Uranus. Moderate change in trend Cattle, Copper, Cotton, Oats.
C. 9/29 AC – Moon’s North Node Contra-Parallel US Saturn. Major change in trend US Stocks, T-Bonds, US Dollar.
D. 9/30 AC – Jupiter 45 US Moon. Moderate change in trend US Stocks, T-Bonds, US Dollar.
E. 9/30 AC – Mercury in Virgo turns Direct. Major change in trend Corn, Oats, SOYBEANS, Wheat.
F. 9/30 AC – Mercury 0 North Latitude. Major change in trend Corn, Oats, Soybeans, Wheat.
G. 10/03AC – Saturn Parallel US Moon. Major change in trend US Stocks, T-Bonds, US Dollar.
Market math
9/30 = 5,468 (Music) days > 10/11/2007 MAJOR HIGH.
Fibonacci – 9/27.
*DJIA – 9/27.
Astro – 9/27, *9/30 AC.
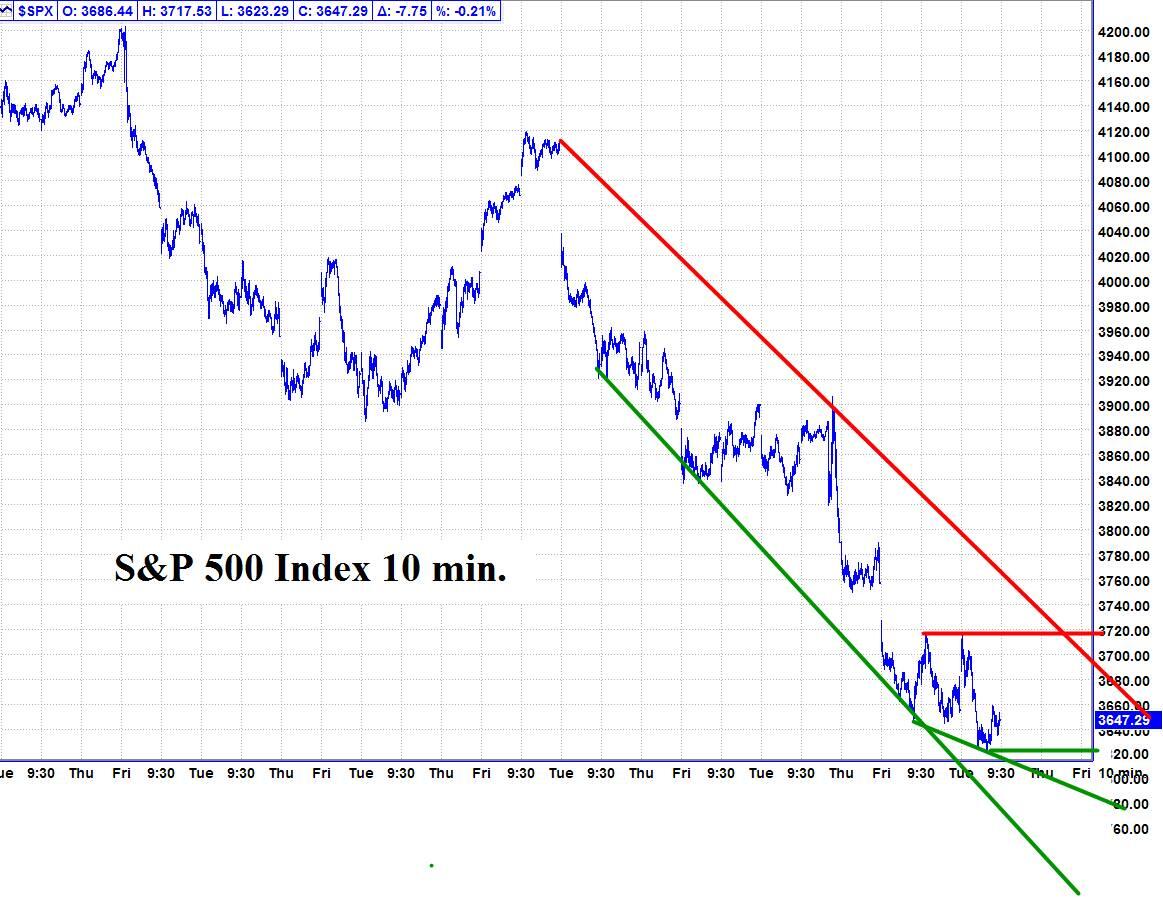
Please see below the S&P 500 10 minute chart.
Support - 3620, 3590, 3540 Resistance – 3720, 3750.
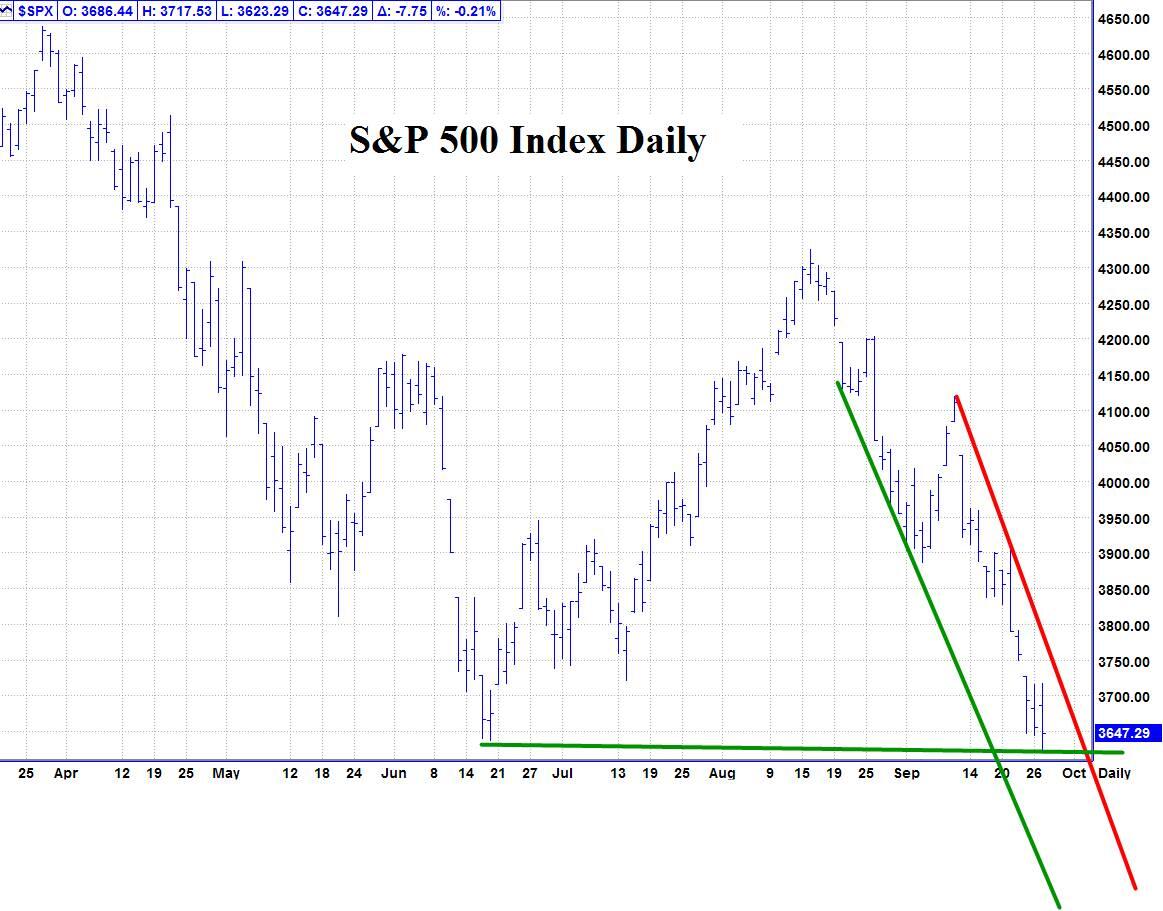
Please see below the S&P 500 Daily chart.
Support - 3640 Resistance – 3720.
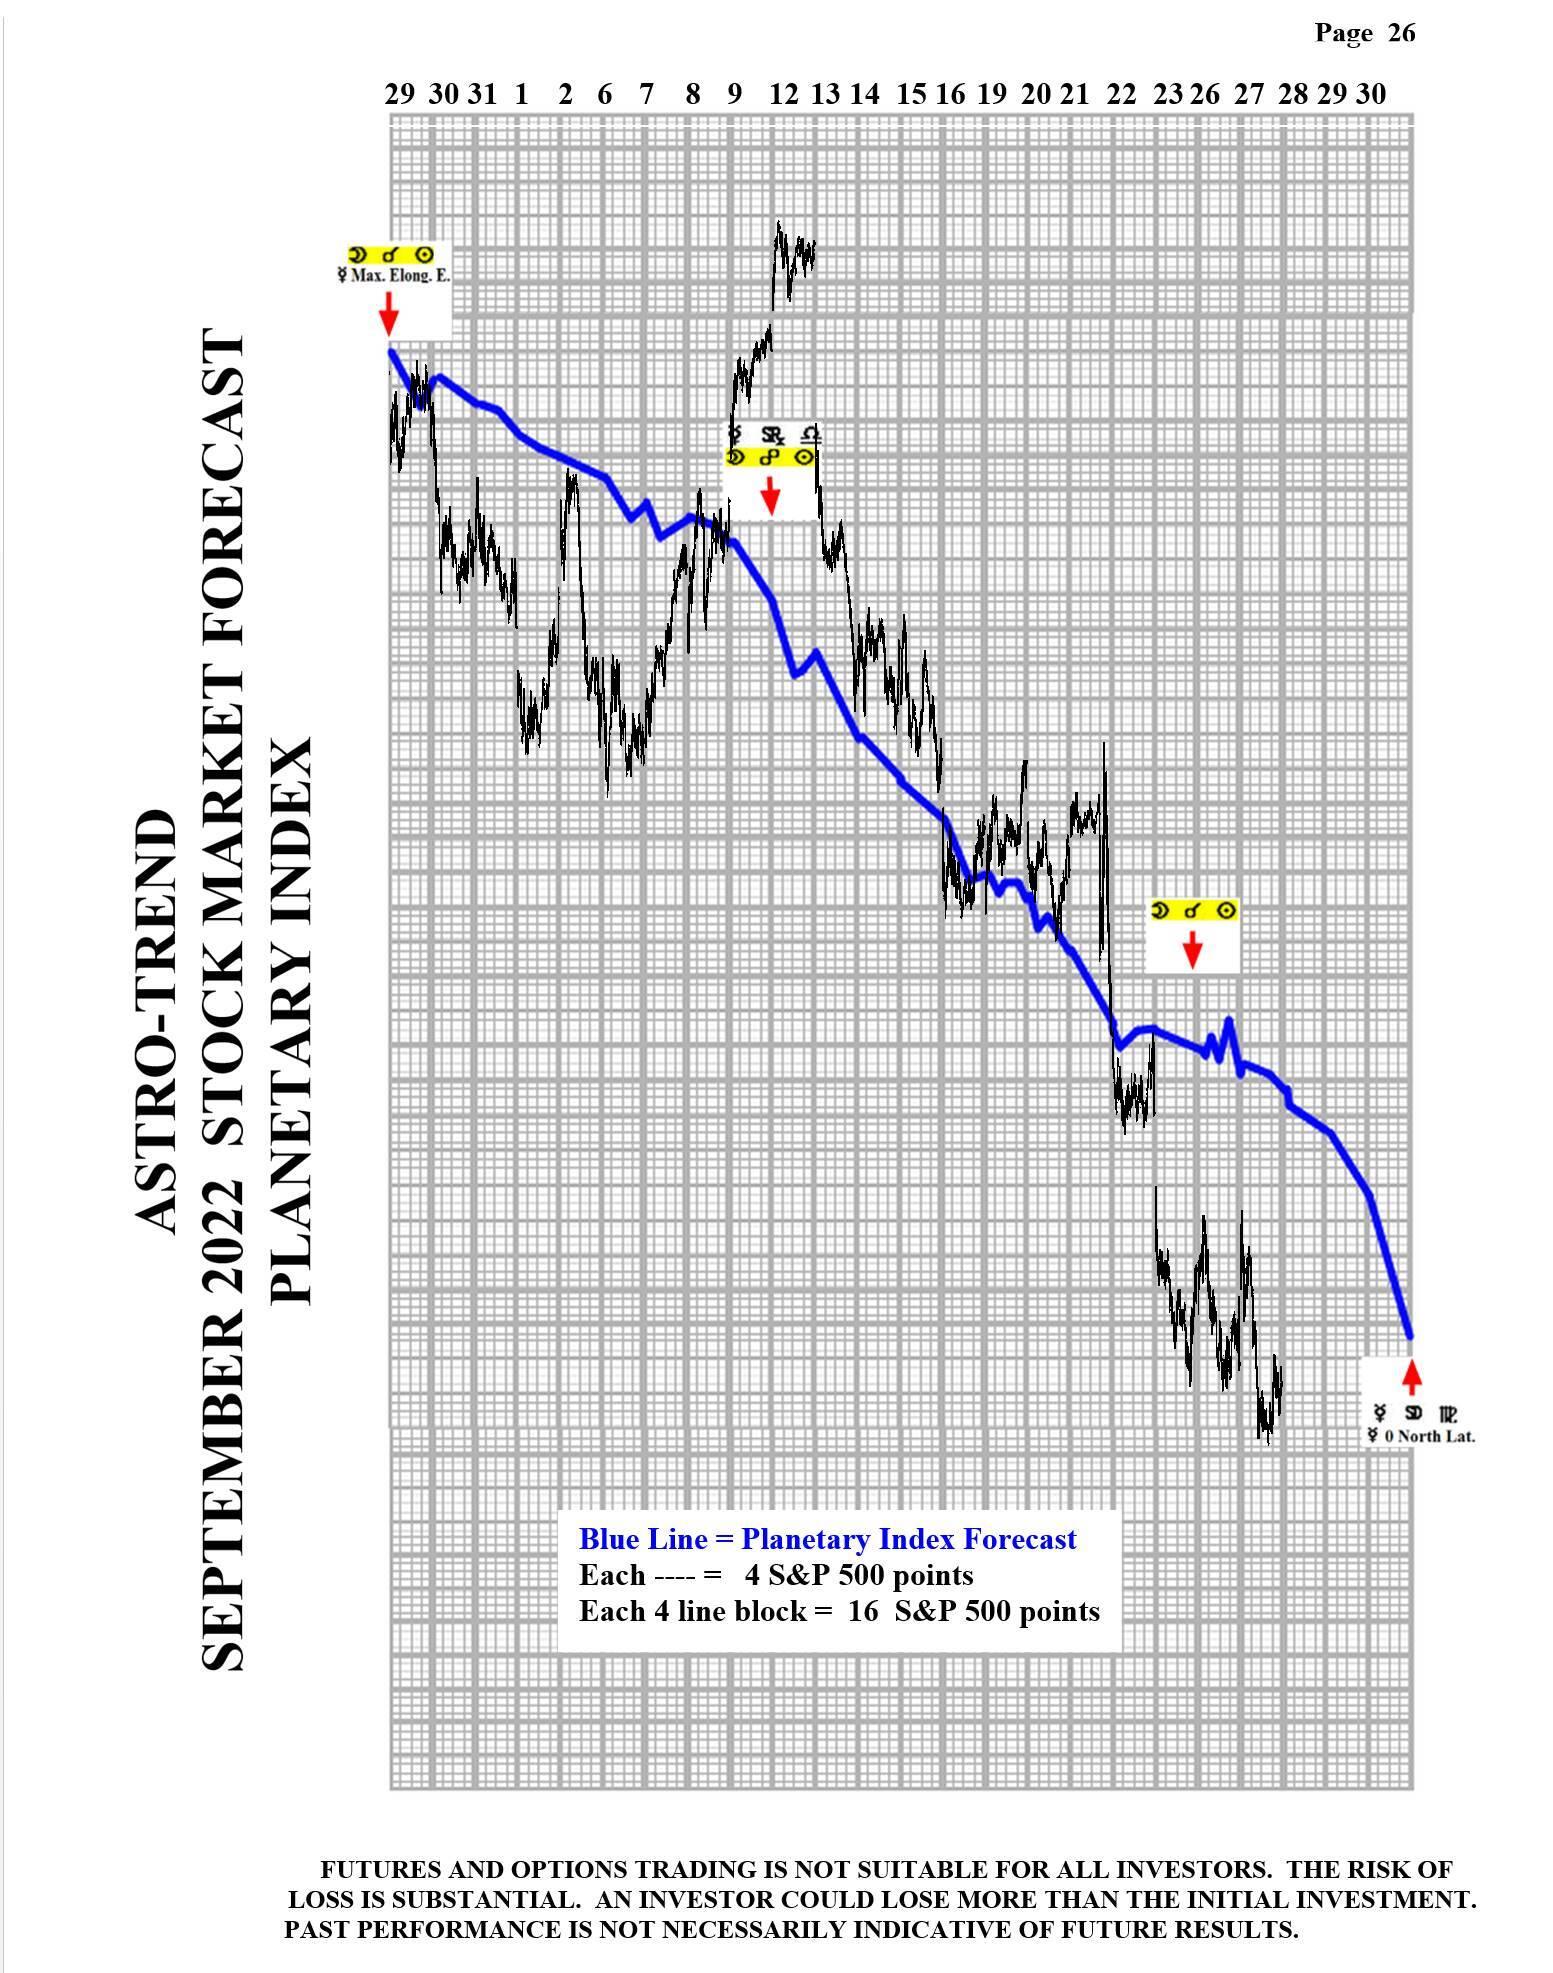
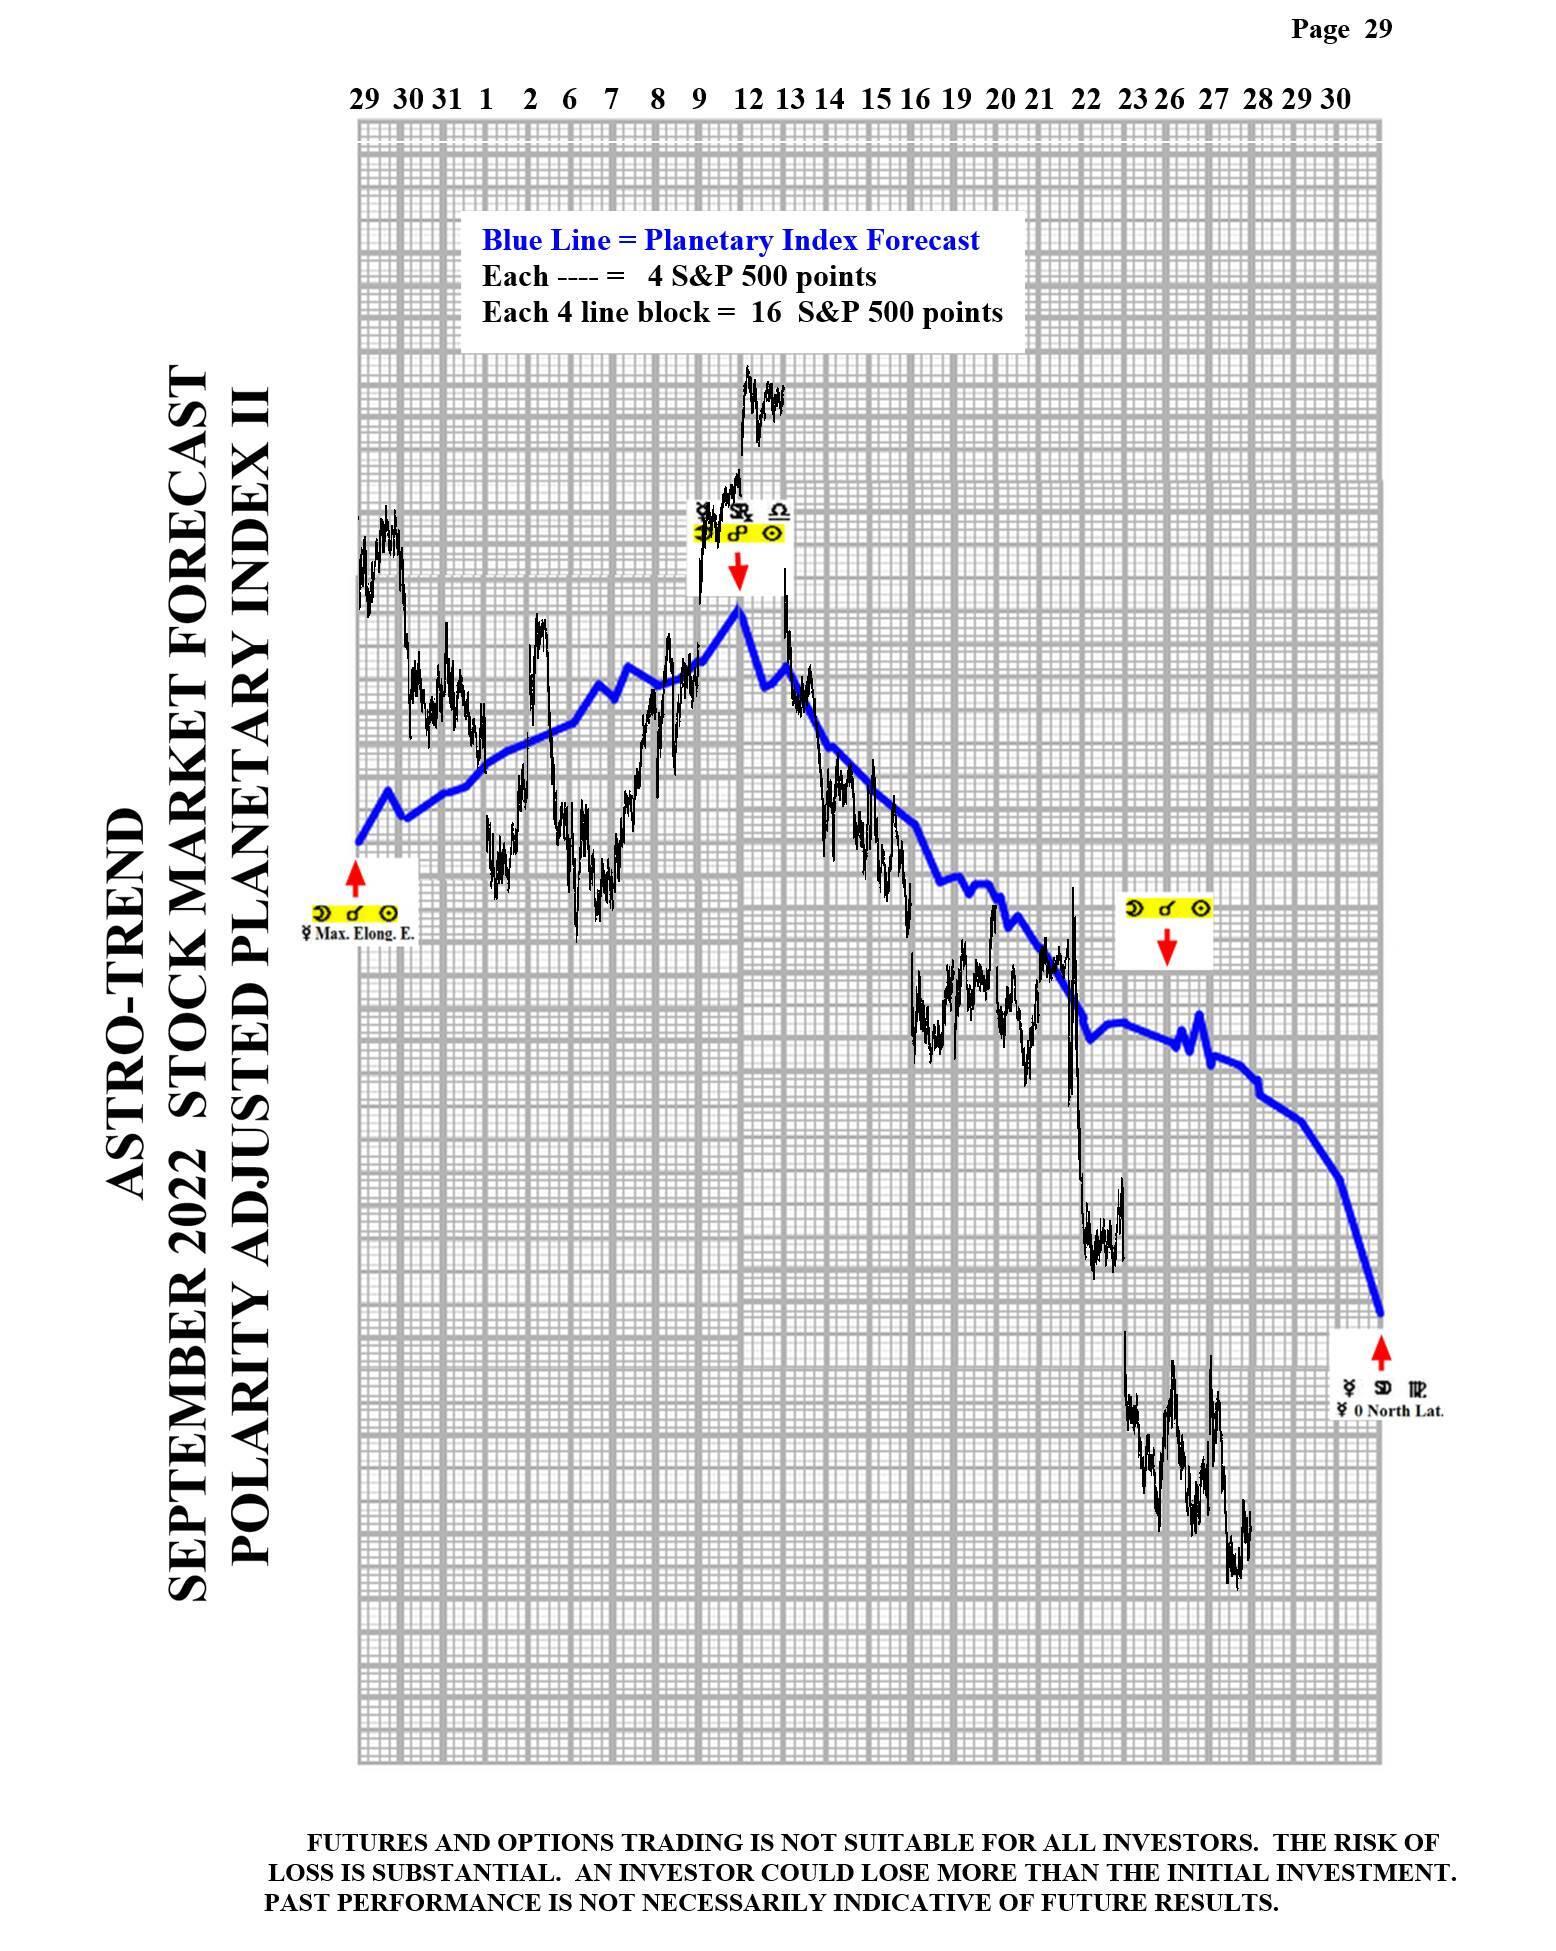
Please see below the September Planetary Index charts with S&P 500 10 minute bars for results. As of September 26, I am dropping the Planetary Index models marked Pages 27 and 28.
Author

Norm Winski
Independent Analyst
www.astro-trend.com


