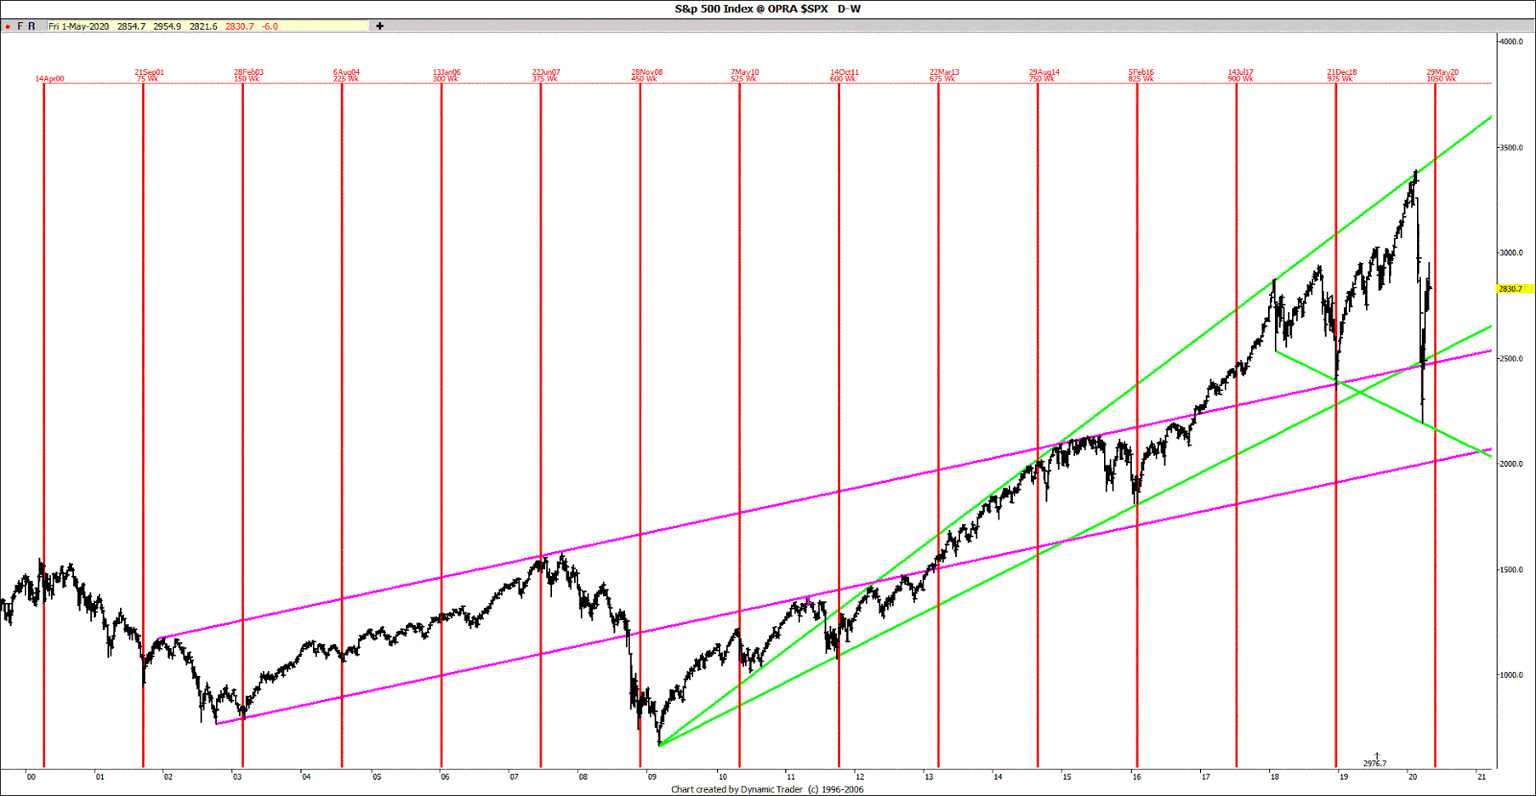
The flash crash cycle is due in May 2020

I have written extensively about my discovery of the Flash Crash (FC) cycle in past posts, including the more recent December 2018 Flash Crash Lows.
I first mentioned the Flash Crash cycle back in May 2010, when the Flash Crash happened and I discovered then there was a regular Flash Crash cycle, which is a Gann 360 TD/525 Calendar day/75 week crash cycle.
In September 2011 for example, the FC cycle was predicting an October 2011 FC Low
Actual: We saw an 10/4/11 major Low
The Flash Crash 360 TD/ 525CD/ 75 week cycle
04/14/00L – 09/21/01L = 01 X 358.00 TD = 01 X 525 CD = 01 X 75.00 weeks
04/14/00L – 03/12/03L = 02 X 363.50 TD = 02 X 531 CD = 02 X 75.86 weeks
04/14/00L – 08/13/04L = 03 X 362.00 TD = 03 X 527 CD = 03 X 73.33 weeks
04/14/00L – 11/21/08L = 06 X 360.67 TD = 06 X 524 CD = 06 X 74.83 weeks
04/14/00L – 05/06/10L = 07 X 361.14 TD = 07 X 525 CD = 07 X 74.98 weeks
04/14/00L – 10/04/11L = 08 X 360.63 TD = 08 X 524 CD = 08 X 74.82 weeks
04/14/00L – 01/20/16L = 11 X 360.36 TD = 11 X 524 CD = 11 X 74.79 weeks
04/14/00L – 12/26/18L = 13 X 361.46 TD = 13 X 525 CD = 13 X 75.05 weeks
9 out of 14 FC Cycles saw 7%-26% (avg 12-16%) declines, 5 in 2-3 wks, 4 in 7-14 wks
03/24/00H - 04/14/00L was a 14% decline in 3 weeks
08/31/01H - 09/21/01L was a 20% decline in 3 weeks
01/31/13H - 03/12/03L was a 16% decline in 8 weeks
06/24/04H - 08/13/04L was a 7% decline in 7 weeks
11/04/08H - 11/21/08L was a 26% decline in 3 weeks
04/26/10H - 05/06/10L was a 12% decline in 3 weeks
09/16/11H - 10/04/11L was a 12% decline in 2 weeks
11/03/15H - 01/20/16L was a 14% decline in 11 weeks
09/21/18H –12/26/18L was a 20% decline in 14 weeks
The 360 TD Cycle is about 75 weeks, which has been in the markets ever since the April 14 2000 mini Crash Low and has since pinpointed 9 major crash Lows in the past 19 years, including the 4/14/00 mini crash Low, 9/21/01 crash Low, 3/12/03L, 8/13/04L, 11/21/08 crash Low, 5/6/10 Flash Crash, 10/04/11 Low, 1/20/15 Crash Low and more recently the 12/26/18 crash Low. It is next due in May 2020.
Many of the 360 TD/75 week flash crash cycle Lows were major Panic Lows, like the 4/14/00 Low, 9/21/01 Panic Low and the 11/21/08 Banking crisis Low. A few, like the 3/12/03 Low and 8/13/04 Low were not Panic Lows, but still major Lows. At times the FC Cycle skips a beat, out of the last 14, 9 (64%) were direct hits and 5 (36%) were misses.
Conclusion: The 360 TD Flash Crash Cycle predicted many crashes and major Lows in the past, including the 4/14/00 crash Low, 9/21/01 crash Low, 3/12/13 Low, 8/13/04 Low, 11/21/08 crash Low, 5/6/10 FC, 10/04/11 crash Low, 1/20/16 Crash Low and the December 26 2018 crash Lows. It is next due late May 2020. Some were misses, but in general, it is a regular cycle to be reckoned with. The Flash crash (FC) cycle, once active sees an average 12-16% decline. As the Flash Crash (FC) Cycle is a 1 1/2 year fixed cycle, it will have a +/- variance of a few weeks, so timing the exact Low will be Key as once the Flash Crash cycle bottoms, we will see a sharp rally afterwards.
Author
Raj Ian G Thijm, MBA
Raj Time and Cycles
I have been actively involved in the Financial Markets since August 1987. After receiving my B.S.


