The Dow Jones Utility Average (DJUA) - Forecasting the End of a Secular Bull Uptrend
The Dow Jones Utility Average (DJUA) is a price-weighted average of 15 utility stocks traded in the United States - the current components are as follows:
-
AES Corp., (AES) - electric utilities
-
American Electric Power Co., Inc. (AEP) - electric utilities
-
American Water Works Company, Inc. (AWK) - water utilities
-
CenterPoint Energy, Inc. (CNP) - diversified utilities
-
Consolidated Edison, Inc. (ED) - electric utilities
-
Dominion Resources, Inc. (D) - electric utilities
-
Duke Energy Corp. (DUK) - electric utilities
-
Edison International (EIX) - electric utilities
-
Exelon Corp. (EXC) - diversified utilities
-
FirstEnergy Corp. (FE) - electric utilities
-
NextEra Energy Inc. (NEE) - electric utilities
-
NiSource, Inc. (NI) - diversified utilities
-
PG&E Corp. (PCG) - electric utilities
-
Public Service Enterprise Group, Inc. (PEG) - diversified utilities
-
Southern Company, Inc. (SO) - electric utilities
The DJUA began trading on the 2nd January 1929 at a level of 85.64 when utility stocks were removed from the Dow Jones Industrial Average (DJIA). An interesting point of early history was that during the Great Depression collapse between 1929-1932, the DJUA underperformed the recovery that began in the Dow Jones Industrial Average (DJIA) from 1932 onwards – in fact, it traded to an historical lower-low in March 1942 at 11.40. So this date is the starting point for its secular-bull uptrend.
In the modern era, the DJUA is considered to be a ‘defensive play’ for portfolio managers. For example, in the first four months of 2016, the Dow Jones Utility Average was up 13.3% per cent versus a 1.0% per cent gain for the S&P 500 index – pretty good performance although allowance is given to the S&P as it declined sharply during January by -9.93% per cent so took another 2-months to recover. But you get the point. Usually, in secular-bull uptrends, the main outperformance comes from technology stocks which has recently been evident by the last 18-month performance of the Nasdaq 100. But Utility stocks are worth watching, especially at times of financial stress.
Using the DJUA as a ‘defensive play’ isn’t always a good idea though – the long-term uptrend from the year-1946 low proves that, in other words, it is not 100% negatively correlated but it can limit losses in a portfolio relative to the DJIA or the S&P when a portfolio manager MUST BE INVESTED IN THE MARKET pretty much all the time, with only an cash-fund allowance of perhaps 5-7% per cent.
We already know that certain academics are forecasting a more immediate end to the secular-bull uptrend for the DJIA and the S&P 500, Nasdaq 100 etc. based upon cyclically adjusted price/earnings ratio, or CAPE, made famous by Yale University finance professor and Nobel laureate Robert Shiller. The CAPE is currently near an historical peak which reads the most bearish for the stock market than at any other time since year-1880 with only two exceptions - right before the 1929 stock market crash and in the months prior to the bursting of the internet bubble in year-2000. Can the current set-up be proven from taking a look at the Dow Jones Utility Average (DJUA) from an Elliott Wave perspective?
No, the Elliott Wave Principle suggests there will be more upside potential before the DJUA signals an end to the secular-bull uptrend for the DJIA, S&P 500 and Nasdaq100 – see fig #1. From an orthodox Elliott Wave standpoint though, the secular-bull uptrend for the DJUA ended already in November 2000 at 418.30 with the following decline/advance to current levels unfolding as the first two sequences of a multi-decennial EXPANDING FLAT pattern, i.e. A-B-C subdividing 3-3-5.
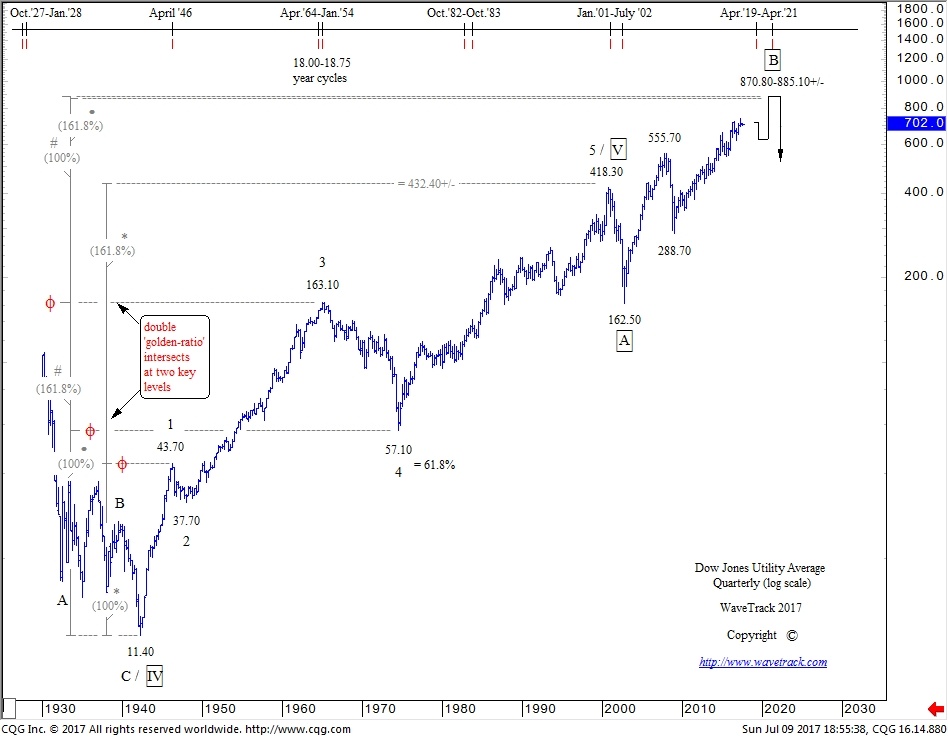
fig# 1 - Dow Jones Utility Average - Quarterly Chart by WaveTrack International
The secular-bull uptrend from the year-1946 low of 11.40 can be seen unfolding into a cycle degree five wave expanding-impulse pattern labelled 1-2-3-4-5. To begin with, it is worth noting that the 5th wave is classified as the ‘extended’ sequence because it is larger than waves 1 and 3. There are also some amazing FIB-PRICES-RATIOs in this pattern. For example, extending cycle wave 1 by a fib. 161.8% ratio projects the terminal high for wave 5 towards 432.40+/-. The actual high traded to 418.30!
The following activity then begins the counter-trend phase of this advance by unfolding into the multi-decennial EXPANDING FLAT pattern. Labelled in super-cycle degree, A-B-C, wave A completed a seven wave double zig zag decline into the Oct.’02 low of 162.50 – the following recovery began super-cycle wave B which is itself unfolding into a single zig zag which remains incomplete. We know it is incomplete because of the internal structure of cycle wave C of this zig zag – it requires more upside so that it subdivides into a five wave impulse pattern. But can we ‘proof’ this from using FIB-PRICE-RATIO’s?
Yes we can. The ‘B’ waves of an expanding flat often trade to higher-highs at the price level intended for the terminal high of the preceding secular-bull uptrend. When the secular-bull uptrend ends short, the ‘B’ wave of the correction compensates by reaching the fib-price-ratio target. This is what we anticipate recurring in the DJUA. For example, extending cycle waves 1-3 of the secular-bull uptrend by a fib. 61.8% ratio projects super-cycle wave B towards 885.10+/-. Also, extending waves 1-4 by an inverse fib. 161.8% ratio projects wave B towards 870.80+/-. This double ‘golden-ratio’ level is the markets ‘harmonic’, it is attracting the price towards it which means the current advance cannot collapse into a secular-bear downtrend until reached sometime over the next few years.
Note that in times of real financial stress, the DJUA collapsed at the same time as all the other indices in 2000-2002, and in 2007-2009 but it tends to provide its defensive role OUTPERFORMANCE at times of lesser importance, like in Q1 2016 (see comments above).
As for timing the end of a secular-bull uptrend for the DJIA, S&P 500 and the Nasdaq 100, this will be such a major event that we’d expect the DJUA to also decline rapidly, just as it did in those two previous occasions. The 18.00 and 18.75 year cycles shown at the top of the chart depict a time-horizon anywhere between April ’19 and April ’21. That might seem a big gap to trade in, but it does eradicate the idea from CAPE that a more imminent ‘BLACK SWAN’ event could happen now. We’ll be relying on the final Elliott Wave pattern sequences within super-cycle wave B to help pinpoint the exact timing.
Author

Peter Goodburn
WaveTrack International GmbH
WTI HISTORY


