China closed stocks trading today, after CSI 300 tumbled 7% applying its new regulations which have been imposed, after last August sell-off.
PBOC defied the capital outflows probability by sending by setting USD/CNY at 6.5646 today to be at its highest level in the recent 6 years, with continued POBC's injections in the financial markets to restore confidence.
POBC indicated today that the Yuan is to respect the market forces and it has 2 ways to move in 2016 not only one way.
While China Securities Regulatory Commission managed to put new rules to be enact next week to restrict the selling pressure by limiting the Major shareholders' selling of any listed company to only 1% a day each 3 months and they should mention any of their selling of shares 15 days earlier.
While the Chinese Yuan is still suffering from the odds of watching economic slowdown in China and further easing measurements by POBC, the Japanese yen could gain benefits from this suffering to replace the Yuan as an Asian competitive reserve currency, with no signal yet from BOJ to take further easing steps.
JPY could take the market participants' attention in the first trading week of the year, as this low cost financing currency usually gains benefits by unwinding of the carry trades during the risk-off sentiment.
Instrument in Focus: GBPUSD
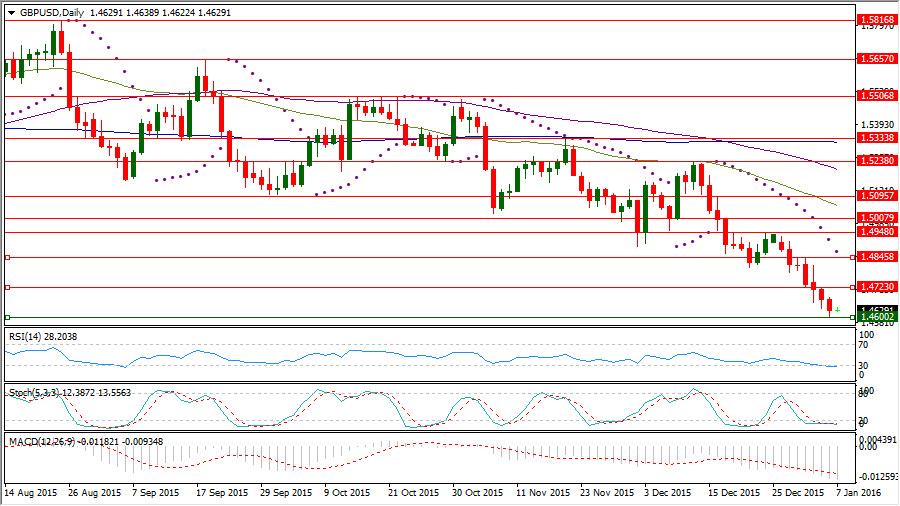
GBPUSD could hardly find support at 1.46 to rebound for trading near 1.46 currently keeping trading below its daily Parabolic SAR (step 0.02, maximum 0.2) for 16 consecutive days reading today 1.4869, after 7 dark days to be in a deeper place below its Daily SMA50, Daily SMA100 and Daily SMA200 having oversold stance.
As the cable daily Stochastic Oscillator (5, 3, 3) which is sensitive to the volatility has its main line is in oversold area below 20 reading now 12.387 and also its signal line which is reading 13.556.
After the cable faced increasing of the downside momentum following forming another lower peak at 1.4948 below 1.5238 which capped its rebound on last Dec. 11.
Important levels: Daily SMA50 @ 1.5059, Daily SMA100 @ 1.5208 and Daily SMA200 @ 1.5319
S&R:
S1: 1.4600
S2: 1.4564
S3: 1.4345
R1: 1.4723
R2: 1.4845
R3: 1.4948
GBPUSD daily Chart:
Commodities: CL Feb. 16
Despite the tension between Iran and Saudi Arabia because of Saudi Arabia’s execution of Saudi Shiite Cleric which sent CL FEB 16 up to 38.37 in the beginning of the new year and despite the falling of US EIA Oil stockpile of the week ending on Jan. 1 by 5.085, while the market was waiting for decreasing by only 0.5m, WTI managed to have new 12 years low reaching $32.77 a barrel yesterday.
As the increasing doubts about the Chinese economic activity and the weaker than expected US manufacturing performance by the end of last year could dominate the market sentiment hurting the demand expectations.
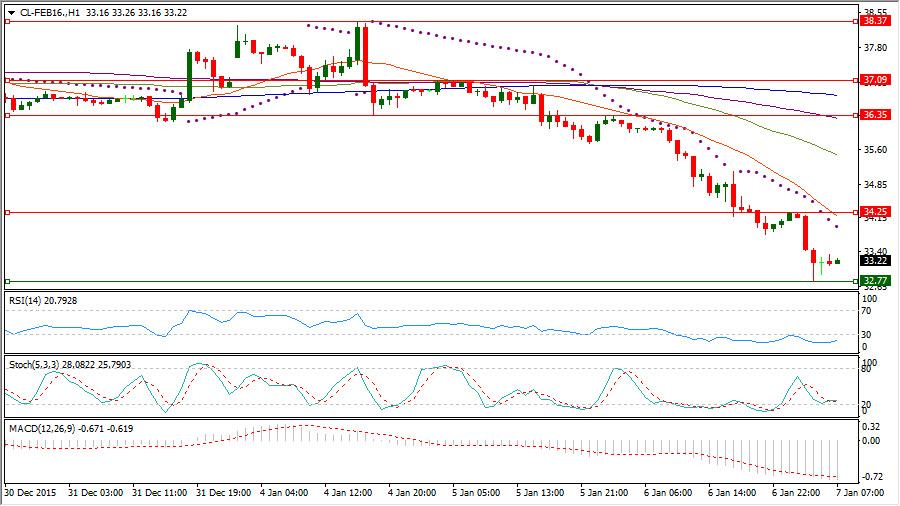
After opening the new week on upside gap, CL FEB 16 which reached $38.37 to have hardly a place above its daily SMA20 came again under increasing selling pressure to break yesterday its formed bottom at $35.16 on Dec. 11 by a new pulse wave could be extended to $32.77, before rebounding for trading near $33.25 currently with continued existence below its hourly SMA20, SMA50, SMA100 and SMA200.
CL FEB 16 has formed intermediate resistance level at $36.35 and also at $34.25 during yesterday slide which is still leading its daily Stochastic Oscillator (5, 3, 3) which is sensitive to the volatility to have its main line in the oversold region below 20 reading now 8.729 and also its signal line which is referring to 17.058.
Important levels: Daily SMA20 @ $36.49, Daily SMA50 @ $40.28, Daily SMA100 @ $42.74 and Daily SMA200 @ $48.80.
S&R:
S1: $32.77
S2: $31.28
S3: $30
R1: $34.25
R2: $36.35
R3: $38.37
CL Feb. 16 Hourly chart:
Hot instrument: SP-MAR16
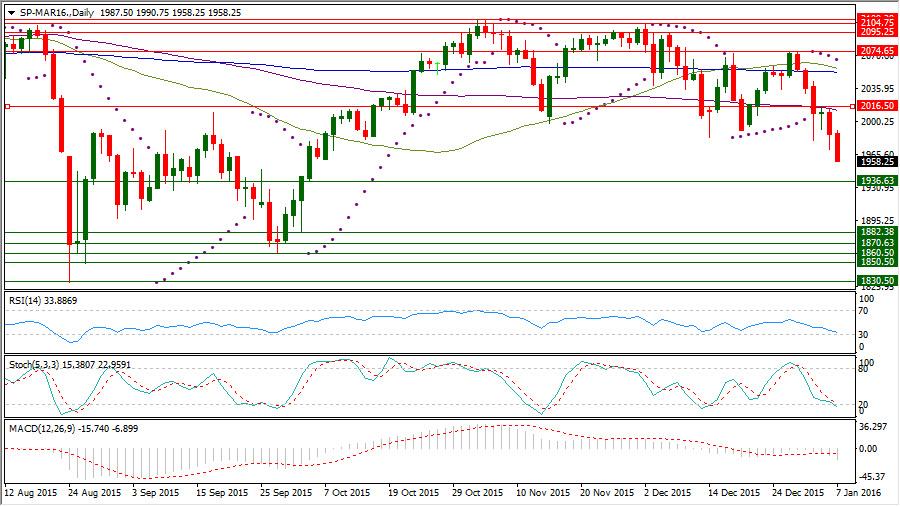
1980 level which could withstand in the beginning selling day of the week failed to send SP-MAR16 higher than 2016.50 whereas it failed to get over its daily SMA100 forming another lower high to renew the downside pressure which drove the index to reach 1958.25 until now, after breaking another supporting level at 1959.88.
As what has been exactly mentioned in the report of last Tuesday, SP-Mar16 has previously formed a lower high at 2074.65 on Dec. 30, after facing difficulty several times to keep a place above 2100 to be exposed now to downside extension more than before with higher probability of forming more lower highs.
SP-Mar16 daily Stochastic Oscillator (5, 3, 3) which is sensitive to the volatility is having now its main line in the oversold region below 20 reading now 15.380 below its signal line which is still in the neutral territory reading now 22.959.
Important levels: Daily SMA50 @ 2057.40, Daily SMA100 @ 2012.84 and Daily SMA200 @ 2052.81
S&R:
S1: 1936.63
S2: 1882.38
S3: 1870.63
R1: 2016.50
R2: 2074.65
R3: 2095.25
SP-MAR16 Daily chart:
Recommended Content
Editors’ Picks
AUD/USD: Uptrend remains capped by 0.6650

AUD/USD could not sustain the multi-session march north and faltered once again ahead of the 0.6650 region on the back of the strong rebound in the Greenback and the prevailing risk-off mood.
EUR/USD meets a tough barrier around 1.0800

The resurgence of the bid bias in the Greenback weighed on the risk-linked assets and motivated EUR/USD to retreat to the 1.0750 region after another failed attempt to retest the 1.0800 zone.
Gold eases toward $2,310 amid a better market mood

After falling to $2,310 in the early European session, Gold recovered to the $2,310 area in the second half of the day. The benchmark 10-year US Treasury bond yield stays in negative territory below 4.5% and helps XAU/USD find support.
Bitcoin price coils up for 20% climb, Standard Chartered forecasts more gains for BTC

Bitcoin (BTC) price remains devoid of directional bias, trading sideways as part of a horizontal chop. However, this may be short-lived as BTC price action consolidates in a bullish reversal pattern on the one-day time frame.
What does stagflation mean for commodity prices?

What a difference a quarter makes. The Federal Reserve rang in 2024 with a bout of optimism that inflation was coming down to their 2% target. But that optimism has now evaporated as the reality of stickier-than-expected inflation becomes more evident.


