The credit markets gave their nod to the SP 500 upswing

Yesterday’s session did away with the non-confirmation of last week’s reversal from the 50% Fibonacci retracement. Junk corporate bonds lent their support to the stock upswing, and the S&P 500 closed above the 61.8% Fibonacci retracement. Will the bulls be strong enough to confirm the breakout, or is a correction next?
SP 500 in the Short-Run
Let’s start with the daily chart perspective (charts courtesy of http://stockcharts.com ):
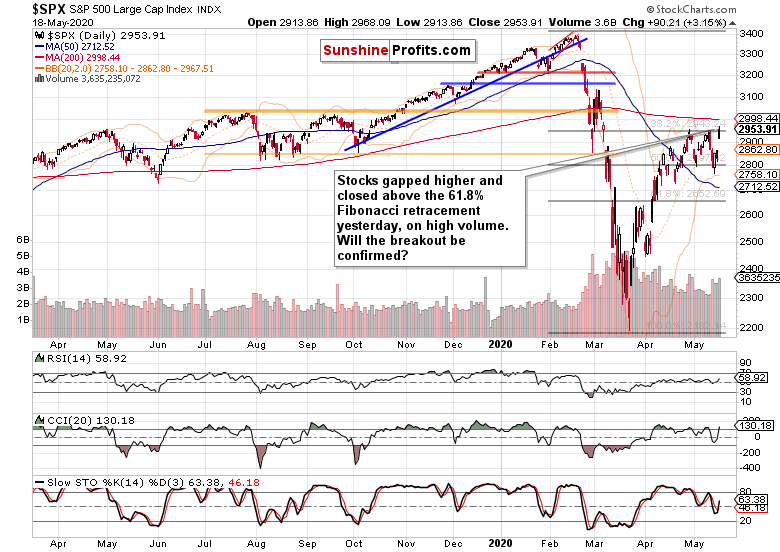
Steadily rising in the runup to the start of the US session, stocks opened with a sizable bullish gap. And they haven’t looked back since, closing on high volume above the key resistance, the 61.8% Fibonacci retracement. Reflecting the upswing, the daily indicators turned largely supportive.
What has happened as far as headlines go? We got another Powell statement, but it didn’t bring materially bullish surprises. Be the judge – he said that the US economy can decline 20-30% amid the pandemic, with the downturn possibly being with us till late 2021. His next remark that the Fed hasn’t exhausted its toolbox isn’t totally new either – it’s only that during his Wednesday’s Peterson Institute webinar, the call for more fiscal measures was the prominent one.
The willingness to reverse and expand the shrank versions of active lending programs, or introduce new ones, appears to be really there. And it didn’t require a more sizable downswing – the breakdown attempt below the 50% Fibonacci retracement was all it took. Fed Chair’s testimony before the Senate Banking Committee is coming later today, with stocks moving down to the low 2940s.
The second piece to the puzzle has been the Moderna (MRNA) early trial vaccine announcement. Despite the study’s focus being safety, and that the composition was actually tested in two low doses on merely 8 patients, the stock market reacted broadly and positively on these interim results. It should be said however, that both the stock itself and the healthcare sector (XLV ETF) as such, have formed sizable black candles, i.e. they gapped higher but gave up large amounts of the opening gains.
These were our yesterday’s intraday observations:
(...) we’re dealing with a sizable bullish gap that makes a move higher later today likely. On the other hand, our expectation as to tomorrow’s Powell testimony remain the same – i.e. a downswing in its wake remains likely.
Chances are, the HYG ETF won’t decline in a bearish attempt to close the gap.
As credit has been underperforming stocks recently, stocks don’t have to spring higher immediately after the HYG ETF overcomes its highs. At the same time, a large part of the rationale for the short position has been taken away with the HYG ETF action so far.
At the same time, buying a breakout attempt doesn’t come without its own set of risks. It’s unconfirmed yet.
In closing, today’s market action so far has given more weight to the bullish case, and our scenario of a slow grind higher still seems most probable.
The bullish gap remains open, supporting the buyers. High yield corporate bonds indeed haven’t declined yesterday, and have caught up with the stock upswing seen on Thursday and Friday. As stocks refused to decline, the slow gring higher over the coming weeks and months got more likely.
The below comments on the S&P 500 prospects expressed in our yesterday’s flagship Stock Trading Alert remain valid also today:
(...) As the coronavirus infection charts appear to have relatively stabilized, and the Fed offered ample support at a critical juncture, the stock market hasn’t sold off in a dramatic way since. Moving from the March 23 lows to the 50% Fibonacci retracement, it has overcome this resistance and taken twice on the 61.8% one. Last week, the 50% retracement held as support.
The above paragraph would speak in favor of a near-term trading range between the two retracements. But would that mean that no selloff below the lower one can happen? Absolutely not, the 2720 or even the low 2600s can get tested. And that needn’t to happen on very adverse corona-related developments. Faced with incoming data, the market can start to doubt whether we’re within sight / we’ve reached the bottom and the real economy is on the mend now. Continuing unemployment claims, retail data, manufacturing figures and similar would show. Or escalation in US-China trade tensions can drive the stock selloff similarly to the way it did early on Friday. Or the Fed playing the monetary interventions on-off game, can work to similar effect.
Still, having gone as high from the low 2200s, the risk of retest or breakdown below these lows, isn’t there at the moment. Not with all the implicit and explicit Fed support, the many fiscal stimulus measures, and crucially, not unless corona goes from we-have-flattened-the-curve to oh-it’s-exponential-again. Despite the relative complacency and the dangers it brings, we’re still far from the market pressing the panic button.
Reaching 2800, 2720 or the low 2600s wouldn’t count as panic. Considering this year’s swings, a move to these levels (especially the first two, but there’s potential for an overshoot to the 2600s) would constitute a relatively shallow correction, after which a slow grind higher could go on (barring catastrophic corona developments). After all, we’re in an election year.
Let’s check yesterday’s key move that happened in the credit markets.
The Credit Markets’ Point of View
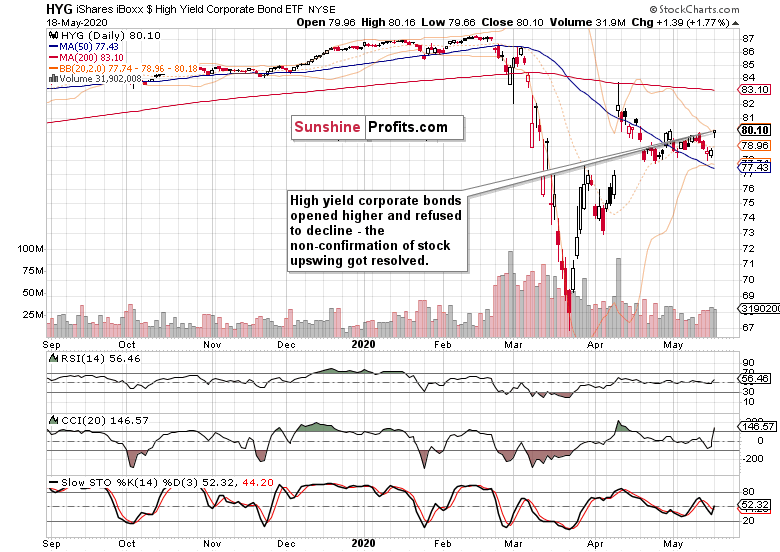
High yield corporate debt (HYG ETF) gapped higher, rejected the intraday attempt to move lower, and finished with more gains. The volume on the upswing has been respectable, and the daily indicators paint a bullish picture for the sessions to come.
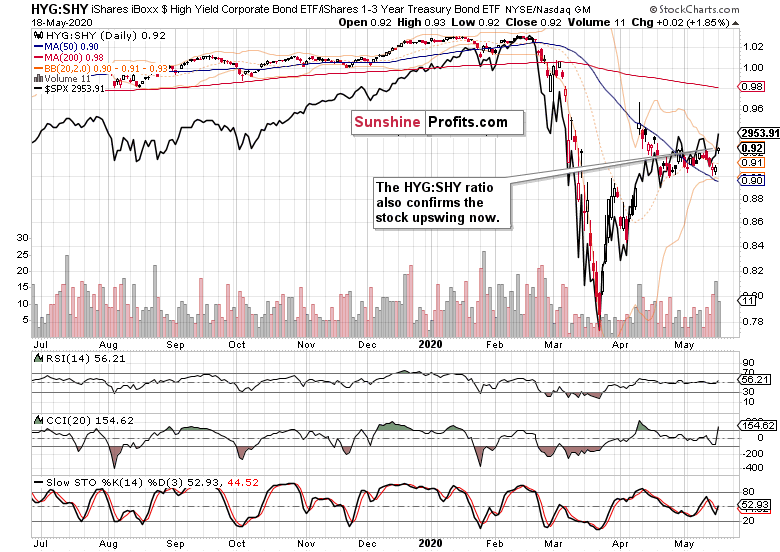
The high yield corporate bonds to short-term Treasuries ratio (HYG:SHY) now also confirms the overlaid S&P 500 chart’s upswing (the black line). Relatively speaking though, stocks are getting a bit pricey as they’re the asset class leading higher.
Key SP 500 Sectors in Focus
Technology (XLK ETF) kept its bullish gap open, hesitantly rising during the day on low volume. Healthcare (XLV ETF) erased around two thirds of its bullish gap, while financials (XLF ETF) rose to the midpoint of their April range. It’s been only the consumer discretionaries (XLY ETF) that overcame their recent highs.
Among the stealth bull market trio, both energy (XLE ETF) and materials (XLB ETF) are challenging their local tops, with industrials (XLI ETF) not lagging too far behind. The volumes behind there upswings attest to the unfolding resumption of a push higher, supporting our hypothesis of slow grind higher over the coming months.
Summary
Summing up, yesterday’s upturn in the credit markets dealt with the key remaining obstacle in the prospect of generally higher stock prices. The breakout above the 61.8% Fibonacci retracement stands a chance of being confirmed perhaps as early as this week. The effects of today’s Powell testimony should prove temporary in keeping a lid on stock prices. As outlined, while we don’t expect a sizable selloff, we don’t see dramatic gains as overly likely either. The best known measure of volatility, VIX, appears to support this view. The perceived likelihood of the real economy bottom being at hand, also speaks in favor of the above.
Want free follow-ups to the above article and details not available to 99%+ investors? Sign up to our free newsletter today!
Want free follow-ups to the above article and details not available to 99%+ investors? Sign up to our free newsletter today!
Author

Monica Kingsley
Monicakingsley
Monica Kingsley is a trader and financial analyst serving countless investors and traders since Feb 2020.


