The bond market could well be getting it wrong on inflation

Outlook: We get the usual Thursday jobless claims today, expected at a drop by 10,000 but while both initial and continuing claims are each falling, the 4-week moving average is actually rising, something the astute Gittler at BDSwiss spotted and is borne out by the TradingEconomics chart.
-637649748719245958.png)
We are still befuddled and puzzled by why the benchmark 10-year bond yield is so low when the inflation data is so high—at least 3.5% and perhaps as high as 6.5%, depending on the measurement method, and certainly more than the Fed’s target 2%+ however far you want to stretch it. But we talk about inflation only when some new bit of data comes out, and then forget about it. Younger traders who were not around for the last inflation crisis—1979-80, when Fed chief Volcker brought out the bazooka—may find this odd but not abnormal. But it is abnormal. We count on the bond market to tell us about inflation expectations. It’s not doing that today.
The reason is that we have all bought into the Fed’s narrative about transitory price increases and how they will go away in the next few months. Boston Fed Rosengren let a cat out of the bag when he said supply constraints are deadly serious and will affect prices for far longer than we think, and others point to housing costs as more than sticky downward—it’s cement. We’re getting a respite on oil prices because of worries about China and OPEC committed to lifting output, but oil can always come back.
In other words, the bond market could well be getting it wrong on inflation and allowing the Fed to be behind the curve when it’s behind the curve itself. The WSJ, without this introduction, offers a cockamamie story about why yields are so low, attributing it to the 5-30 spread. The 30 part of it fell hard after the June meeting.
“Investors and analysts pay close attention to the 5-30 spread because it can show how near-term monetary policy is expected to affect the long-term economic outlook. In the early days of an economic expansion, the spread tends to be large because investors expect easy-money policies to help spur growth and inflation. The spread then tends to shrink as the Fed raises interest rates to cool the economy.
“This year, the gap between five- and 30-year Treasury yields initially increased partly because Fed leaders were promising unusually easy policies even as investors were anticipating an especially strong economic rebound.” The tipping point came at the June meeting, when the Fed said its patience with inflation is not without limit, driving the 30-year down and the 5-year up.
But wait a minute--since July 1, “…the yield on the 30-year Treasury bond has dropped to 1.913% from 2.086%, while five-year yield has slid to 0.777% from 0.901%.”This is not convergence—it’s capitulation. The WSJ story slides off into nothingness without an ending sentence that tells us… anything.
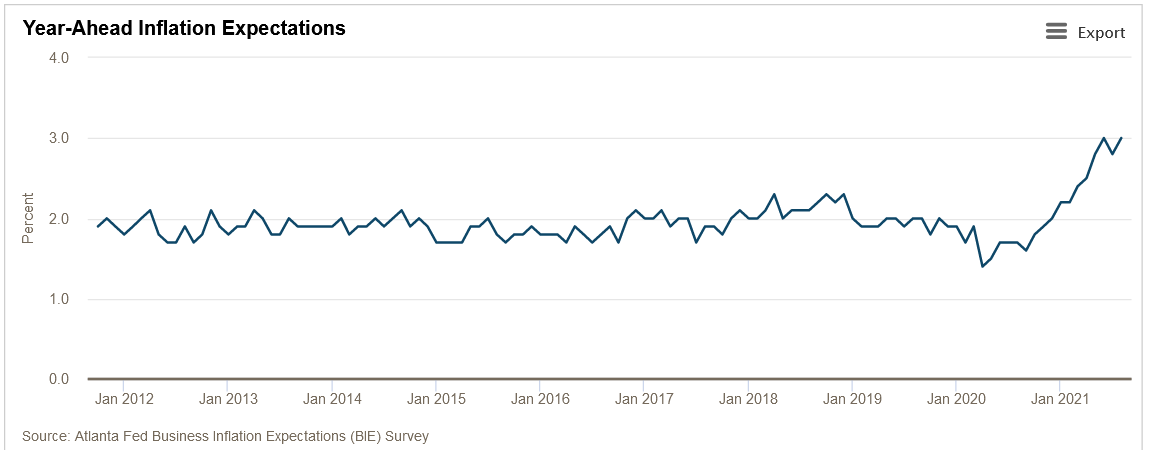
While the 5-30 indicator might be what the bond gang considers important, when all the yields are falling, surely it means inflation expectations are falling. But this is not validated by some of the data. The Atlanta Fed business inflation survey, for example, showing businesses expect inflation up from about 2%, where is has been all year, to 3% in August.
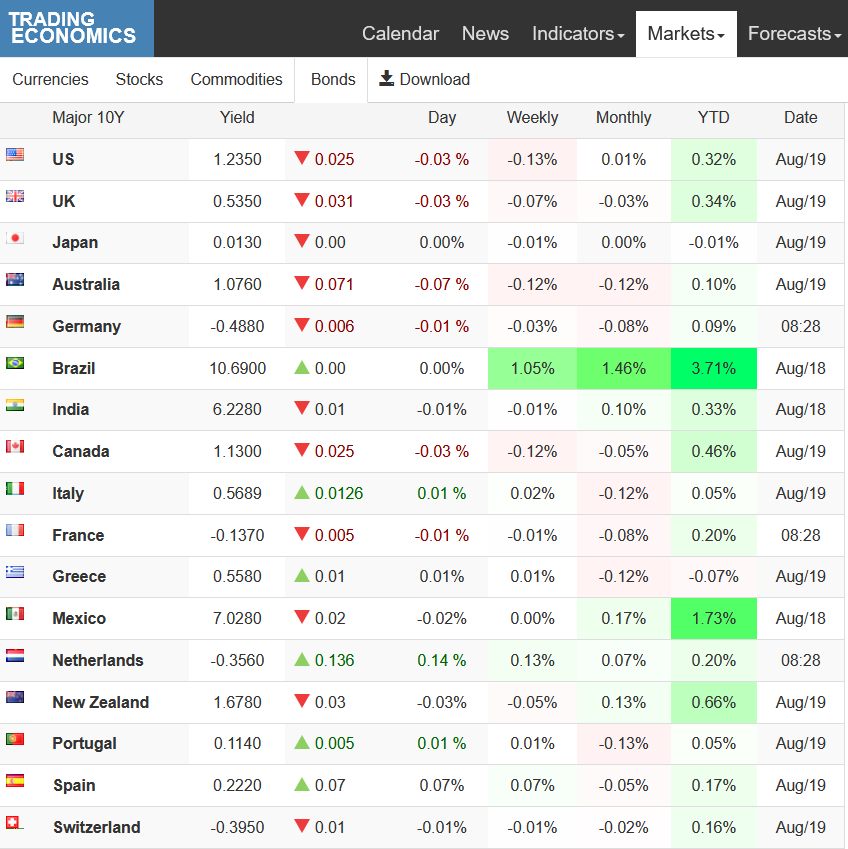
This lack of clarity about inflation could be what’s behind the alternating up and down currency moves in the dollar vs. most others, but especially the CAD, AUD and even peso. Cast your eye over the world yield chart. We are not seeing a correlation with currency outcomes. This was true for some time, but had been coming back as a principle—yields combine growth/inflation and central bank response expectations. Well, not now. It’s likely because of uncertainty over Delta and likely effect on growth just about everywhere—but to ignore inflation altogether still feels strange. The dollar is buffeted by forecasts of slower growth (but with higher inflation) and a dovish Fed (despite higher inflation). This is nonsensical and no wonder the market is seesawing all over the place. A good policy might be to trade only in the one-hour timeframe or not at all—trendedness is not reliable.
Tidbit: The Pentagon is taking a drubbing over the chaos at the Kabul airport. NPR reported the CIA warned the Taliban could take over in days, but the overall consensus of the intelligence agencies was not so pressing. Joint Chief Gen Milley said “There are not reports that I am aware of that predicted a security force of 300,000 would evaporate in 11 days.” Well, of course it did. If the mighty US couldn’t win after 20 years, what chance did the Afghani military have? The NYT reports “Over the past year, intelligence agencies shrank their predictions of how quickly the Afghan government would fall, from two years to 18 months to six months to a month, according to current and former officials. But, according to officials, the warning that its demise was days away never came.”
Despite this black eye, the former president doesn’t scape opprobrium. Snopes reports it’s true that “In 2018, Trump helped Mullah Abdul Ghani Baradar get released from prison [by pressuring Pakistan], in 2020 then-Secretary of State Mike Pompeo met with him, and in 2021 Baradar was set to become the new ‘president’ of Afghanistan under Taliban rule.” Trump also made a deal to release 5000 Taliban prisoners.
Note to Readers: We are taking a holiday next week and there will be no reports on Monday, Aug 23 to Friday, Aug 27.
This is an excerpt from “The Rockefeller Morning Briefing,” which is far larger (about 10 pages). The Briefing has been published every day for over 25 years and represents experienced analysis and insight. The report offers deep background and is not intended to guide FX trading. Rockefeller produces other reports (in spot and futures) for trading purposes.
To get a two-week trial of the full reports plus traders advice for only $3.95. Click here!
Author

Barbara Rockefeller
Rockefeller Treasury Services, Inc.
Experience Before founding Rockefeller Treasury, Barbara worked at Citibank and other banks as a risk manager, new product developer (Cititrend), FX trader, advisor and loan officer. Miss Rockefeller is engaged to perform FX-relat


