Technical view EUR, AUD, and GBP: Welcome bullish tone as USD softens
EUR/USD
European and U.S. equity indexes fell sharply on Thursday as central banks around the world hike rates in attempt to combat rising inflation. Less-than-stellar U.S. economic data and hawkish ECB commentary underpinned the EUR/USD in recent trading, rallying 1.2 per cent.
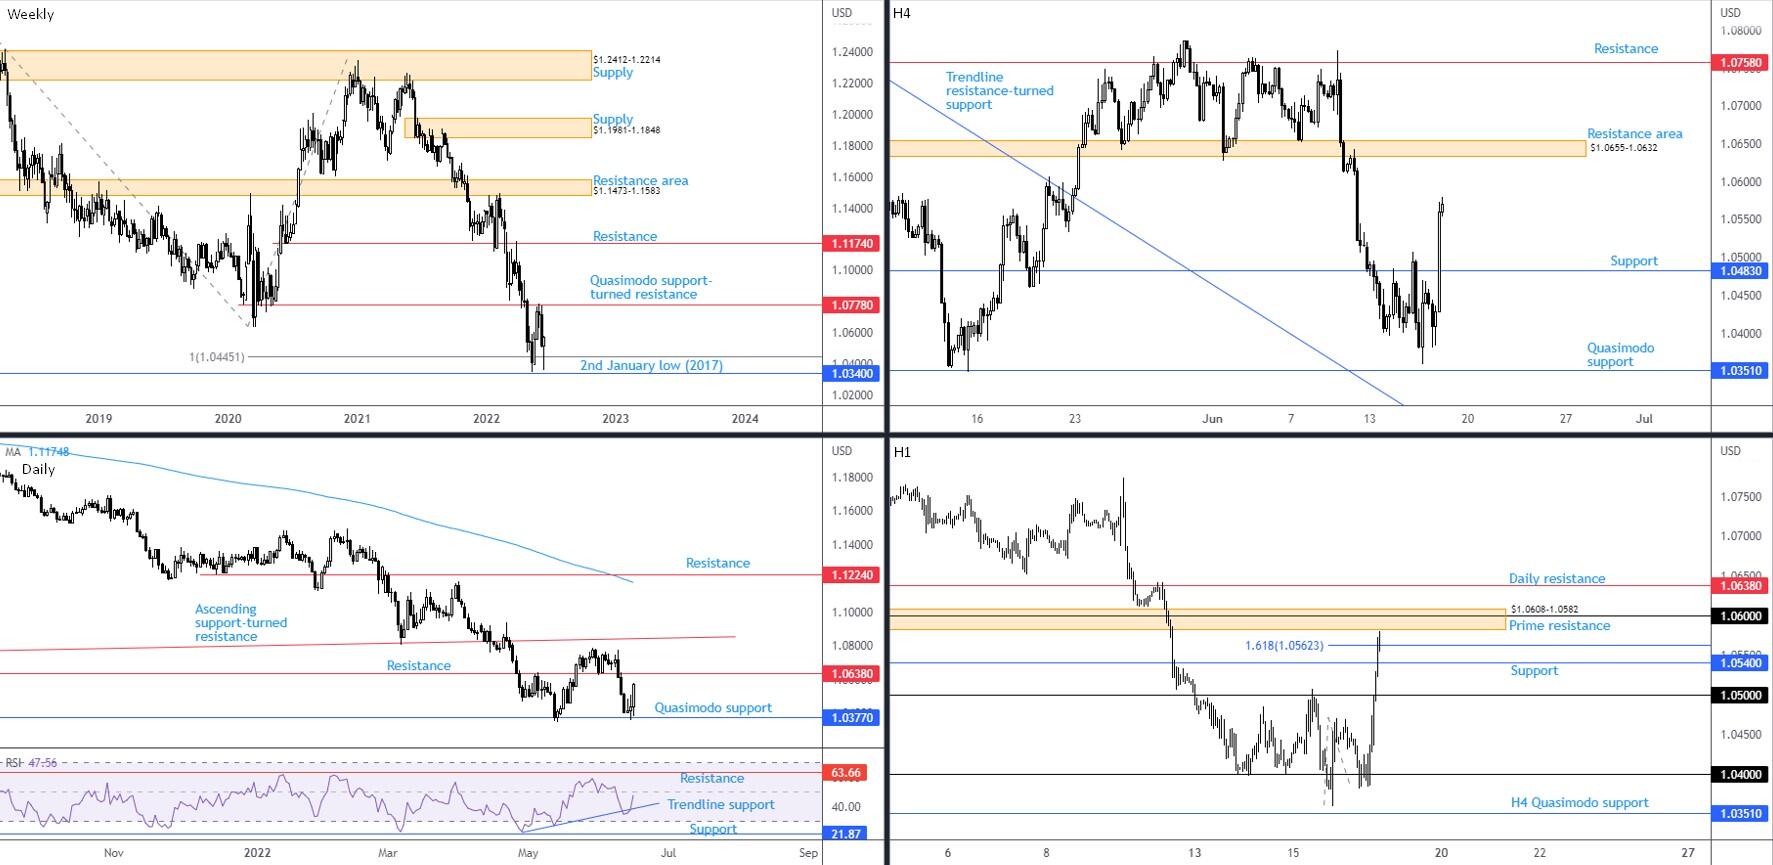
From a technical perspective, although the currency pair has been entrenched within a primary bear trend since 2021, price is recoiling from weekly support (made up between 2nd January low at $1.0340 [2017] and a 100% Fibonacci projection at $1.0445 [AB=CD harmonic bullish formation]). Aiding the aforementioned weekly support, of course, is daily Quasimodo support, stepping into the picture on Wednesday at $1.0377, and trendline support, taken from the low 23.08, on the relative strength index (RSI). Should the momentum gauge continue north, breaking above the 50.00 centreline would be considered a positive sign for bulls (average gains exceeding average losses). Overhead, medium-term price targets call for attention at daily resistance from $1.0638, followed by weekly Quasimodo support-turned resistance from $1.0778.
Across the page, in one fell swoop, price action on the H4 chart engulfed resistance at $1.0483, clearing the river for a potential test of resistance drawn from $1.0655-1.0632. While the charts are clearly echoing a bullish tone right now, the pullback recently shook hands with resistance on the H1 timeframe: a 1.618% Fibonacci projection from $1.0562 (an alternate AB=CD bearish construction). Above here, you will also note a prime resistance zone at $1.0608-1.0582 that houses the $1.06 psychological figure.
Technical Expectation:
It’s unlikely the H1 timeframe’s 1.618% Fibonacci projection at $1.0562 has enough in the tank to halt upside. However, the area between daily resistance at $1.0638 and H1 prime resistance at $1.0608-1.0582 could perhaps put up a fight and allow sellers to show, in line with the current downtrend.
AUD/USD
Thursday witnessed the Australian dollar advance against the U.S. dollar, shaping a second straight bullish session, bolstered on the back of upbeat Australian labour data and soured demand for the greenback.
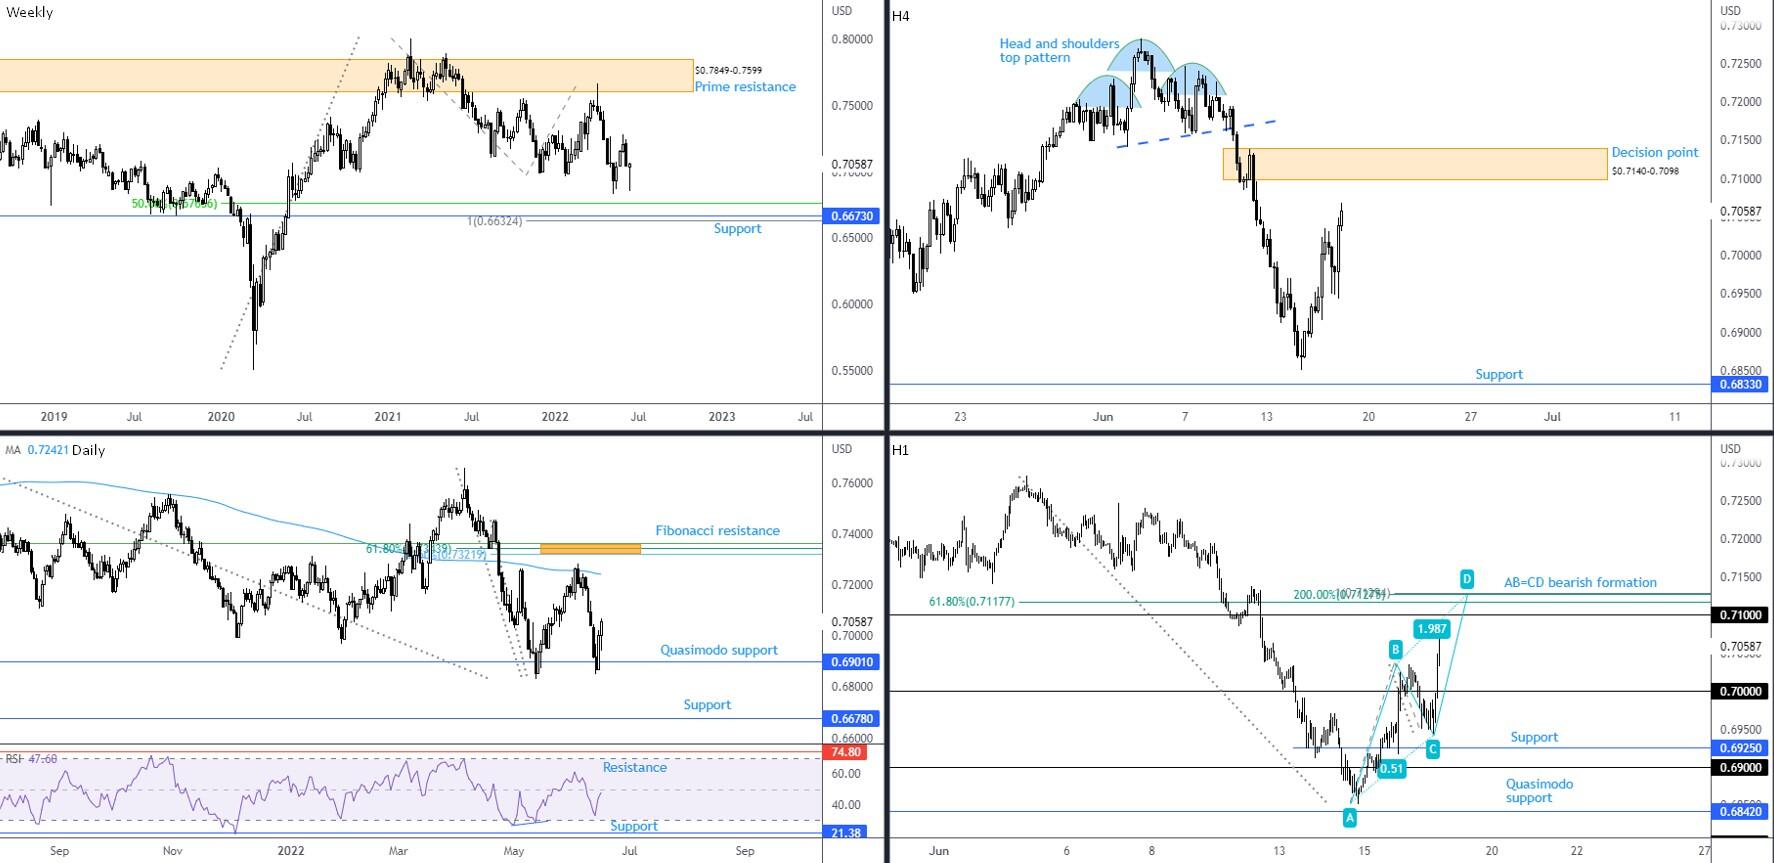
In spite of an enthusiastic pullback in recent days, reinforced by Quasimodo support at $0.6901 on the daily chart, scope to navigate south is evident on the weekly scale. Price action, in line with the current primary bear trend (since early 2021), remains eyeing weekly support between $0.6632 and $0.6764, comprised a 100% Fibonacci projection, a price support, and a 50% retracement.
With that being said, though, room to scale higher on the daily timeframe is seen, taking aim at the 200-day simple moving average at $0.7242.
Addressing the lower timeframes throws the H4 decision point in the mix at $0.7140-0.7098, a clear area of supply that’s close to welcoming price action. Interestingly, sharing chart space with the H4 area, we have the $0.71 figure on the H1 scale, alongside a H1 AB=CD bearish pattern at $0.7129 and a 61.8% Fibonacci retracement ratio from $0.7118.
Technical Expectation:
Having noted the bearish primary trend, and the weekly timeframe pointing to lower levels, a whipsaw above $0.71 to test H1 harmonic resistance at $0.7129 could be in the offing. Given the H1 structure boasts confluence from the H4 decision point at $0.7140-0.7098, sellers may decide to try and put in an appearance at this point.
USD/JPY
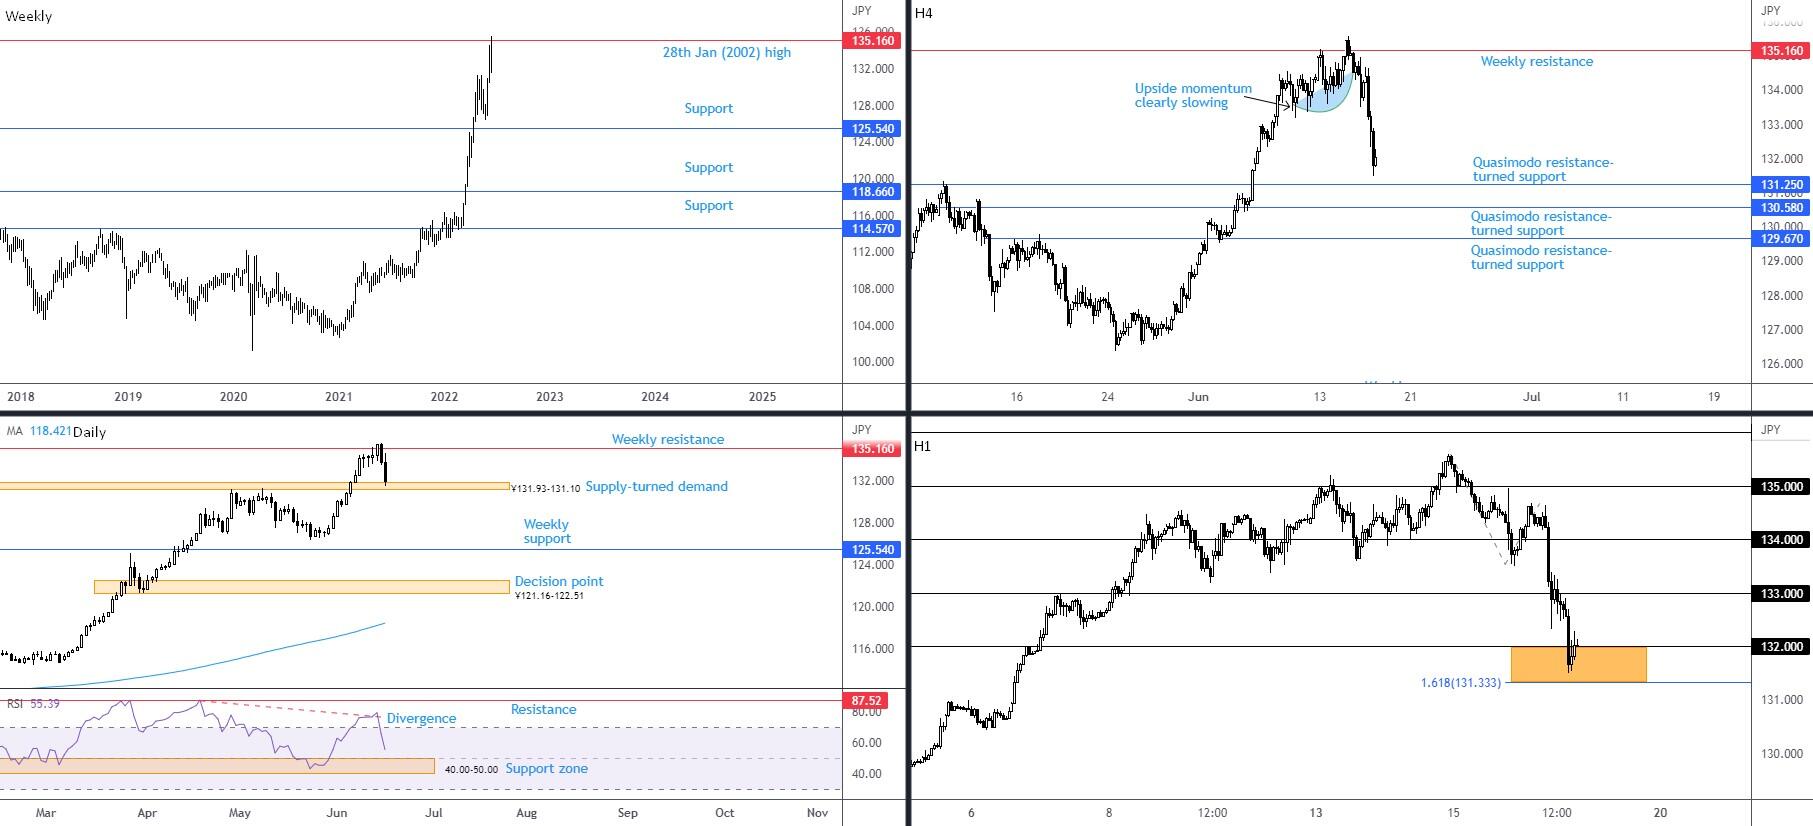
Following a two-week bullish phase, USD/JPY crossed swords with 28th January high (2002) at ¥135.16 and motivated a bearish presence this week, down 1.7 per cent, as of writing. Month to date, the currency pair is still higher by 2.7 per cent, though the weekly timeframe has room to manoeuvre as far south as support from ¥125.54, a level tucked under the ¥126.36 swing low (24th May). Potentially blocking sellers, aside from the unmistakable primary bull trend (since 2021), is daily supply-turned demand coming in at ¥131.93-131.10. If we manage to drop beneath here, the doors, technically speaking, are open for a decline to weekly support highlighted above at ¥125.54. Finally, it’s worth noting that the daily timeframe’s relative strength index (RSI) formed negative divergence within overbought space and is now on the verge of connecting with support between 40.00 and 50.00 (an area serving as a ‘temporary’ oversold region since May 2021 [common view during downtrends]).
In terms of where we stand on the H4 chart, Quasimodo resistance-turned support is seen nearby at ¥131.25, with additional Quasimodo support barriers visible from ¥130.58 and ¥129.67. Based on the H1 timeframe, price movement has recently dropped in on the ¥132 neighbourhood, touching a low of ¥131.49 and missing the 1.618% Fibonacci projection at ¥131.33 by a whisker (joined closely with H4 Quasimodo resistance-turned support at ¥131.25).
Technical Expectation:
This remains a buyers’ market, according to chart studies. The trend is healthy, daily support is active at ¥131.93-131.10, and H1 price is testing support between ¥131.33 and ¥132. Conservative traders, nonetheless, may include H4 support from ¥131.25, therefore providing a support area between ¥131.25 and ¥132 for buyers to potentially work with.
GBP/USD
The immediate aftermath of the Bank of England (BoE) raising its benchmark Bank Rate 0.25 basis points to 1.25 per cent on Thursday watched GBP/USD spike lower, running sell-stops south of the $1.21 figure before rotating north. Sterling finished the session 1.7 per cent higher.
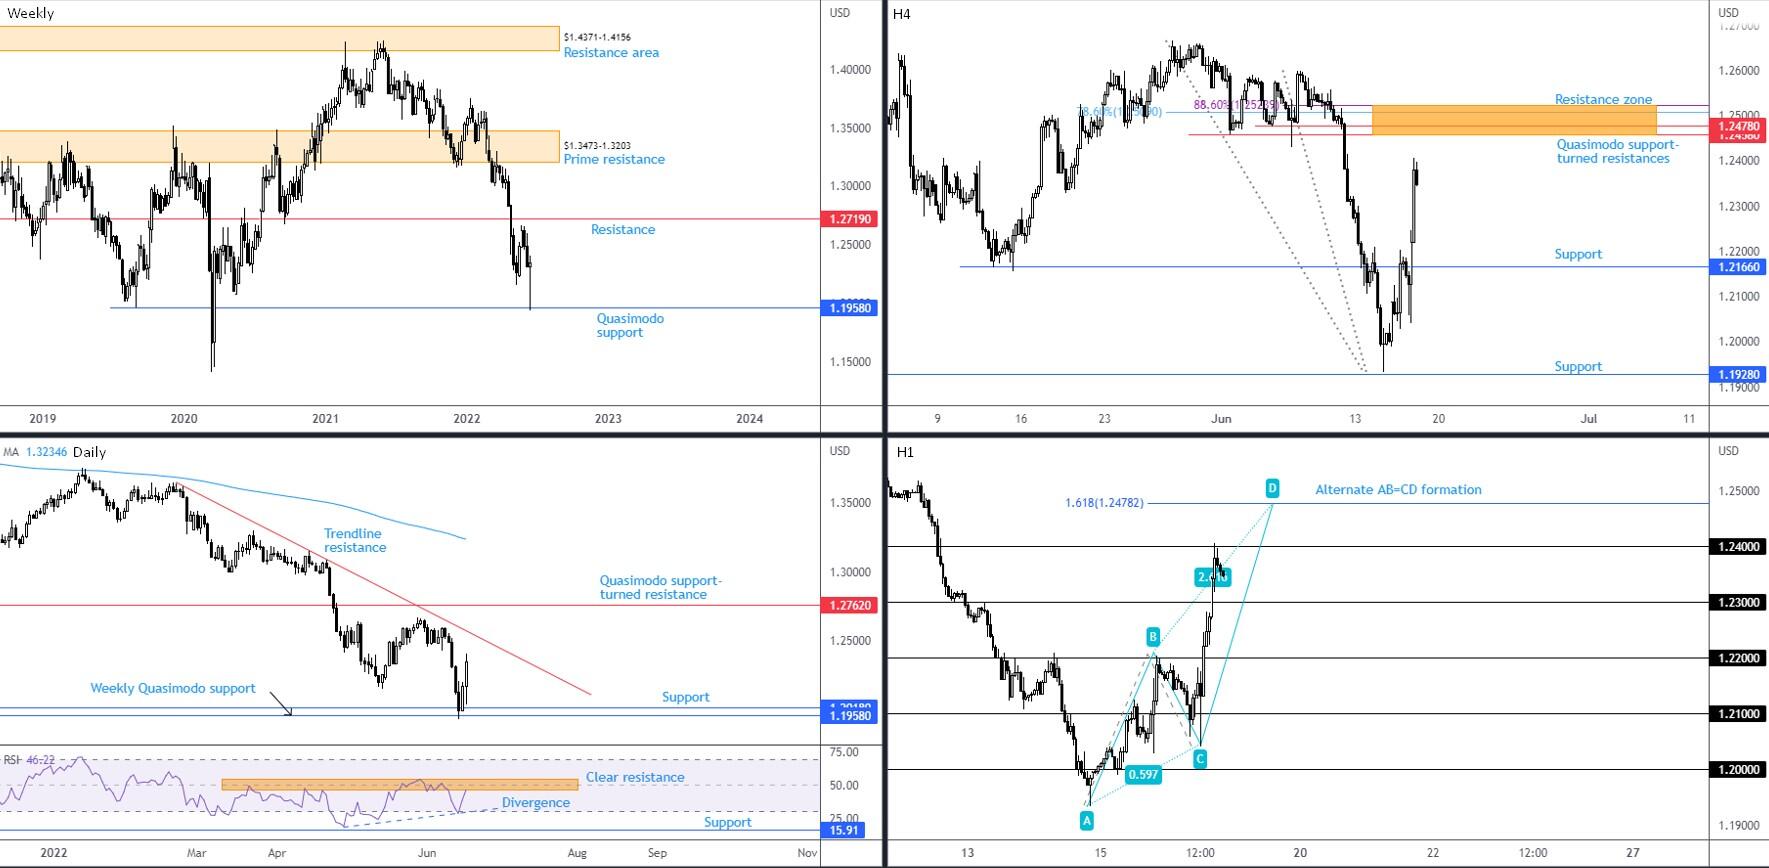
An impressive lower shadow is forming on the weekly timeframe after touching Quasimodo support at $1.1958, on track to perhaps pencil in a hammer candlestick formation (bullish signal). With the help of daily support at $1.2018, daily trendline resistance (taken from the high $1.3639) demands attention, followed by weekly resistance from $1.2719 and daily Quasimodo support-turned resistance at $1.2762. Out of the daily timeframe’s relative strength index (RSI), however, we can see the indicator testing resistance around the 50.00 centreline, following positive divergence.
From looking at the H1 timeframe, it’s clear we’re fading the lower side of $1.24 at the moment. In light of the recent upside momentum and absence of obvious resistance across H4, daily and weekly timeframes, it’s unlikely the $1.24 level serves well as resistance. As such, a H1 close north of $1.24 should not surprise, followed by a subsequent climb to H4 resistance between $1.2524 and $1.2458. Technicians will note this area also joins hands with a H1 alternate AB=CD bearish pattern (1.618% Fibonacci projection at $1.2478) and is located nearby the daily timeframe’s trendline resistance noted above.
Technical Expectation:
A H1 close above $1.24 may open the door to a breakout play for willing buyers, though many will consider this a short-term setup as sellers might emerge from within H4 resistance between $1.2524 and $1.2458.
Author

Aaron Hill
FP Markets
After completing his Bachelor’s degree in English and Creative Writing in the UK, and subsequently spending a handful of years teaching English as a foreign language teacher around Asia, Aaron was introduced to financial trading,


