![]() Slobodan Drvenica
Slobodan Drvenica
Windsor Brokers
EURUSD
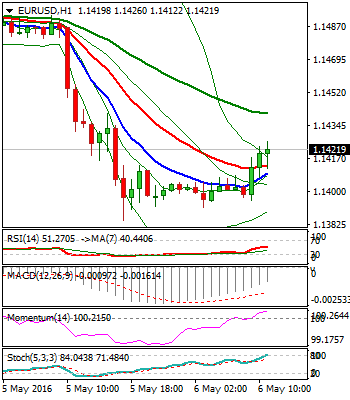
Near-term technicals remain weak, as the Euro ended yesterday’s trading in long red candle. The price dipped to fresh correction low at 1.1384, where rising daily 10SMA offered temporary support for three-day weakness.
However, yesterday’s close below 1.1414 (50% retracement of 1.1213/1.1614 upleg), generated bearish signal, with slide below 1.1484 to expose next supports at 1.1367 (Fibo 61.8% of 1.1213/1.1614 upleg) and 1.1354 (daily 20SMA).
The pair is holding within narrow range and away from solid resistances at 1.1464/72 (former consolidation range floor / Fibo 38.2% of 1.1614/1.1384 downleg), which are expected to ideally cap extended upticks.
Upper breakpoint lies at 1.1527 (consolidation top / Fibo 61.8% retracement) and only break here would neutralize persisting downside pressure.
Res: 1.1464; 1.1472; 1.1527; 1.1560
Sup: 1.1384; 1.1367; 1.1354; 1.1293
GBPUSD
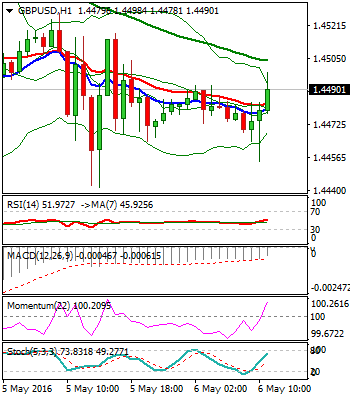
Cable entered narrow consolidation above yesterday’s fresh low of three-day pullback 1.4768 (03 May peak). Yesterday’s long-legged daily candle signals hesitation at significant support at 1.4476 (Fibo 38.2% of 1.4004/1.4768 upleg), which was cracked, but yesterday’s action failed to close below it.
Near-term bears are also supported by Tuesday’s bearish candle with long upper shadow and formation of 5/10SMA’s bear-cross at 1.4556, where initial barrier lies (reinforced by Fibo 38.2% of 1.4768/1.4426 downleg).
Break here would trigger stronger correction and delay immediate near-term bears for extension towards 1.4605 (daily Tenkan-sen / 50% retracement) and 1.4643 (Fibo 61.8% of 1.4768/1.4426), which is expected to cap extended upticks.
Inverse H&S pattern, which is formed on daily chart, remains so far intact, with extension below its neckline at 1.4330, expected to trigger more significant weakness.
Res: 1.4527; 1.4556; 1.4570; 1.4605
Sup: 1.4441; 1.4428; 1.4348; 1.4330
USDJPY
Three-day recovery off fresh low at 105.53 peaked at 107.48, keeping initial barrier at 107.60 intact. Near-term studies remain weak and favor fresh weakness, while the price holds below 107.60 /95 pivots (former base / Fibo 38.2% of 111.87/105.53 downleg), as overall picture is firmly bearish and sees current action as mild correction , before resuming larger downtrend towards initial target at 105.53.
Conversely, sustained break above 108 resistance zone, will generate fresh bullish signal and open way for possible stronger correction of 111.87/105.53 downleg.
Res: 107.48; 107.60; 107.95; 108.70
Sup: 106.85; 106.23; 105.53; 105.18

AUDUSD
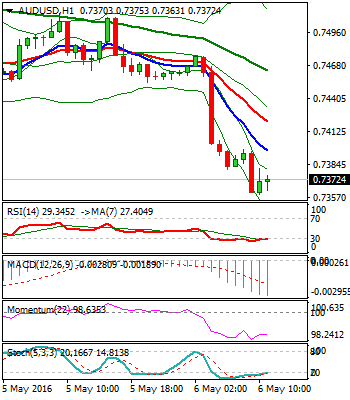
The pair accelerates lower after yesterday’s narrow consolidation, as candles of past two days, with long upper shadows signaled persisting downside pressure.
Fresh weakness eyes initial support at 0.7330 (daily 100SMA / 50% of 0.6826/0.7833 ascend) and base of thick daily Ichimoku cloud at 0.7300, break of which would expose 200SMA at 0.7258.
Bears took control of daily studies and favor further weakness, with corrective actions signaled by oversold daily Slow Stochastic.
Strong resistances lay at 0.7205/15 (daily cloud top / highs of past two days) seen as ideal cap for corrective rallies.
Alternatively, daily close above cloud top, would sideline immediate downside threats.
Res: 0.7476; 0.7505; 0.7515; 0.7546
Sup: 0.7359; 0.7330; 0.7300; 0.7258
The information contained in this document was obtained from sources believed to be reliable, but its accuracy or completeness cannot be guaranteed. Any opinions expressed herein are in good faith, but are subject to change without notice. No liability accepted whatsoever for any direct or consequential loss arising from the use of this document.
Recommended Content
Editors’ Picks
AUD/USD: Uptrend remains capped by 0.6650

AUD/USD could not sustain the multi-session march north and faltered once again ahead of the 0.6650 region on the back of the strong rebound in the Greenback and the prevailing risk-off mood.
EUR/USD meets a tough barrier around 1.0800

The resurgence of the bid bias in the Greenback weighed on the risk-linked assets and motivated EUR/USD to retreat to the 1.0750 region after another failed attempt to retest the 1.0800 zone.
Gold eases toward $2,310 amid a better market mood

After falling to $2,310 in the early European session, Gold recovered to the $2,310 area in the second half of the day. The benchmark 10-year US Treasury bond yield stays in negative territory below 4.5% and helps XAU/USD find support.
Bitcoin price coils up for 20% climb, Standard Chartered forecasts more gains for BTC

Bitcoin (BTC) price remains devoid of directional bias, trading sideways as part of a horizontal chop. However, this may be short-lived as BTC price action consolidates in a bullish reversal pattern on the one-day time frame.
What does stagflation mean for commodity prices?

What a difference a quarter makes. The Federal Reserve rang in 2024 with a bout of optimism that inflation was coming down to their 2% target. But that optimism has now evaporated as the reality of stickier-than-expected inflation becomes more evident.