Technical analysis: WTI futures struggle around 73 mark, latest ascent at risk

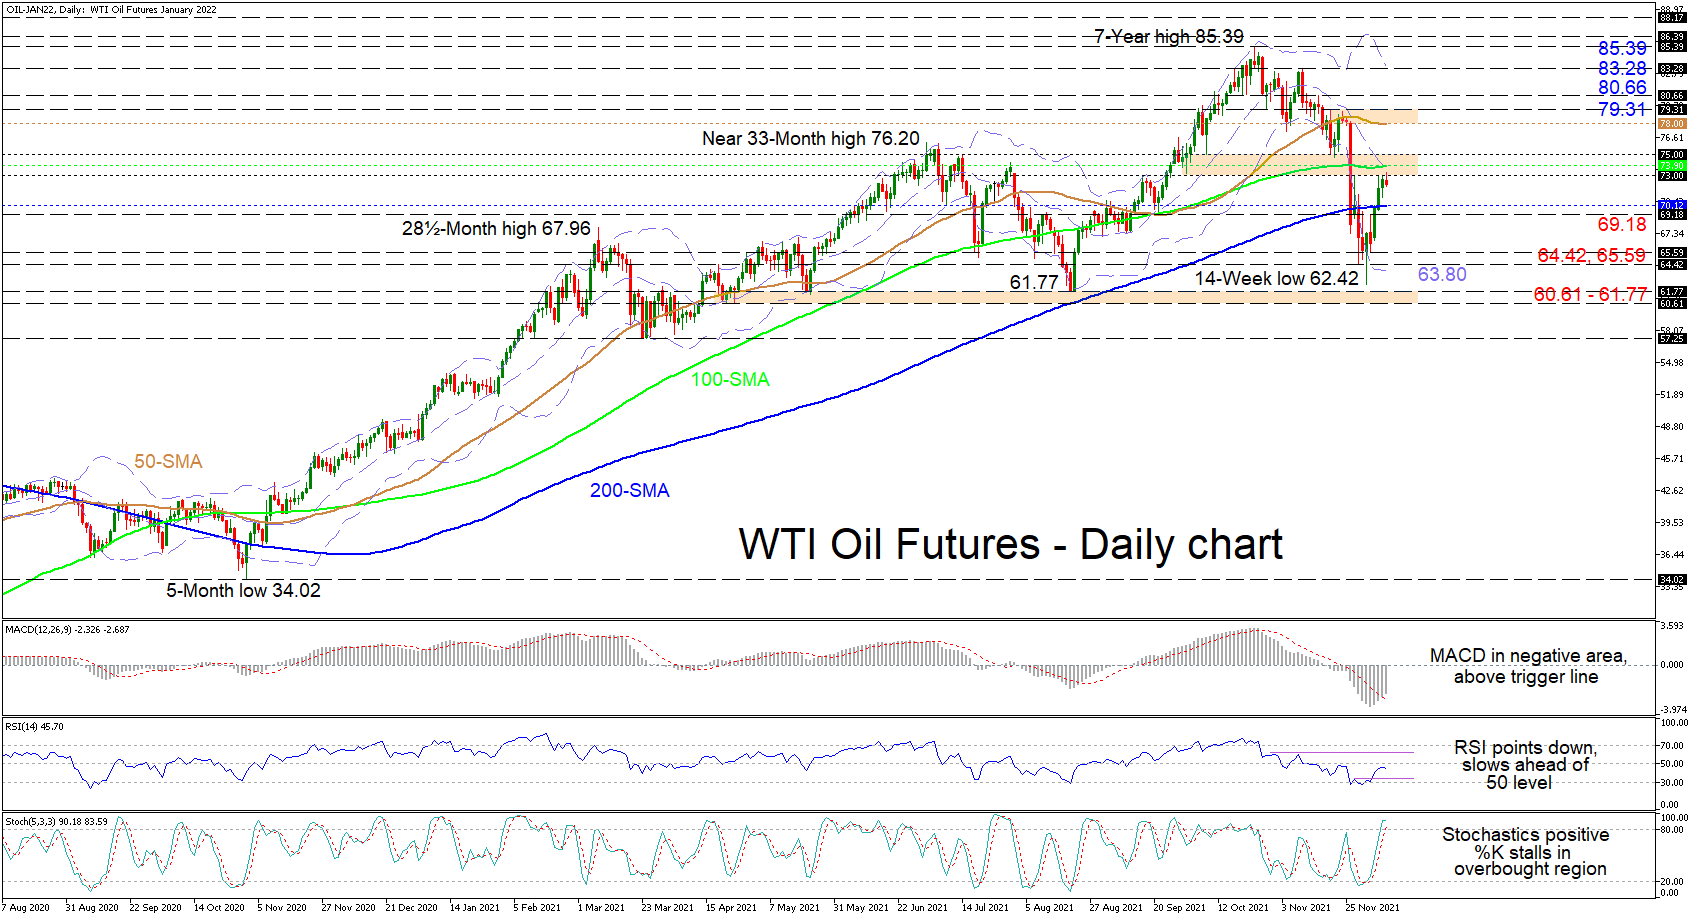
WTI oil futures’ upward thrust from the 14-week low of 62.42 is looking vulnerable as it confronts a critical resistance border formed between the 73.00 and 75.00 handles. That said, the most recent push higher in the price of the commodity seems to have neutralized the growing threat of a negative trend, something also being reflected in the steadier 50- and 100-day simple moving averages (SMAs).
The short-term oscillators are indicating that current bullish forces may not be sufficient to boost upside momentum further. The MACD, in the negative region, has climbed above its red trigger line but remains far below the zero level. The RSI is starting to roll over ahead of its 50 level, showing that negative pressures have yet to fully subside. Moreover, in the overbought zone, the stochastic %K line is hinting that the upward drive may be weakening.
In the positive scenario, an immediate tough section established between the 73.00 and 75.00 handles could curb gains in the commodity. That said, if the price surpasses this important border, reinforced by the mid-Bollinger band and the 100-day SMA, buyers could propel higher for another limiting zone marked by the 50-day SMA at 78.00 and the 79.31 barrier. Conquering these and the adjacent 80.66 high, the bulls may then seek out the upper Bollinger band around 83.28 before targeting the seven-year high of 85.39.
If advances remain capped, preliminary support could arise around the 200-day SMA at 70.12 and the nearby 69.18 obstacle. If bearish powers intensify, the price may dive for the 65.59 and 64.42 neighbouring barriers prior to meeting the lower Bollinger band at 63.80. Should sellers remain in charge, they could then test the 14-week trough of 62.42 before challenging the 60.61-61.77 support base.
Summarizing, WTI futures short-term neutral-to-bullish tone is showing weakness at the 73.00-75.00 key resistance. A break above this could feed optimism in the commodity, while a break below the key 60.61-61.77 foundation may spark worries about the broader uptrend.
Author

Anthony Charalambous joined XM in 2019 and specializes in preparing daily technical analysis, using his years of trading experience to provide detailed forecasting for all major asset classes such as forex, indices, commodities and equities.


