SP500: The Long & Short Of It - AMD, United Technologies, Apache, NiScource

As my colleague Kelvin Wong noted, there are no clear signs of exhaustion on the SP500 which sits just off record highs. Whilst Friday was a bearish close, it warns of a minor pullback at best as there is no evidence of a topping pattern. Moreover, the SP500 E-mini’s are retesting record highs following strong PMI data from China today.
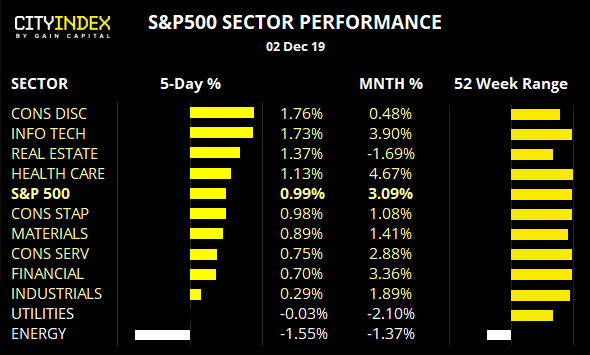
Info tech remains the dominant sector in 2019, having rallied +41.8% YTD, whilst Consumer Services and Financial sectors take 2nd and 3rd place as 28.4% and 26% respectively.
Energy remains in the doldrums, having gained a mere 1.7% YTD.
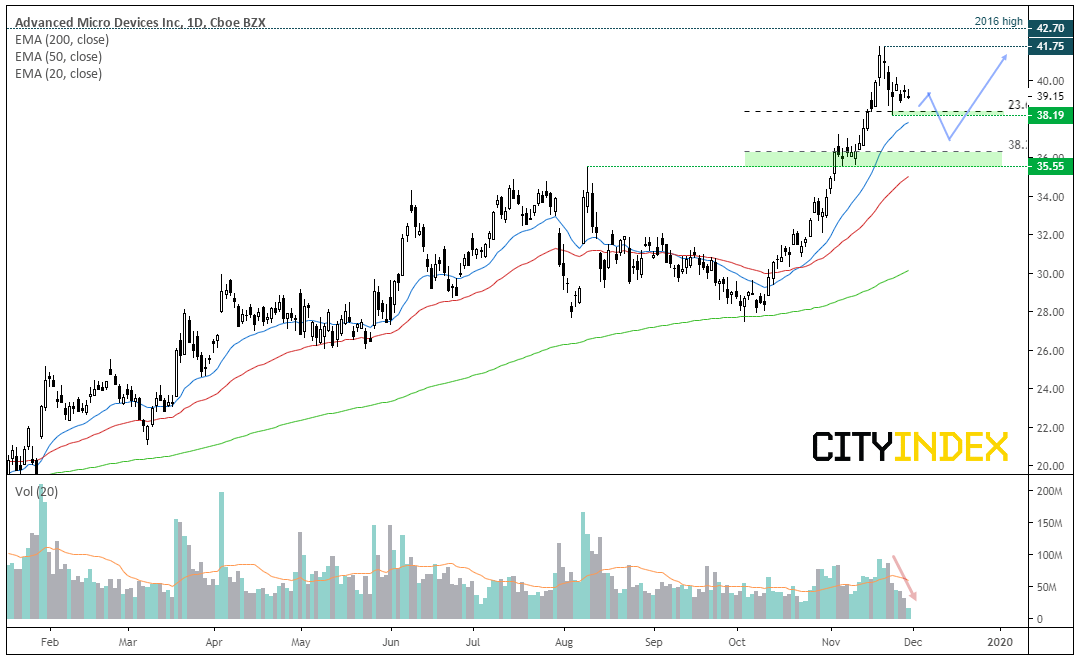
Advanced Micro Device CFD/DFT: A performing stock in a performing sector, AMD has rallied an impressive 112% year to date. Since touching a record high of 41.75 in November, prices have moved lower but on thinner volumes to suggest the move is corrective, so we’re looking out for new level of support to build before it breaks to fresh highs.
-
A spinning top doji marks a potential swing low at 38.19 near the 23.6% Fibonacci ratio. If bullish momentum returns above this level, it can be assumed the correction has ended.
-
The 35.55 – 36.00 zone may provide better support upon a deeper retracement. If a higher low forms near or above this zone and bullish momentum returns, bulls could look to target the 2019 and 2016 highs.
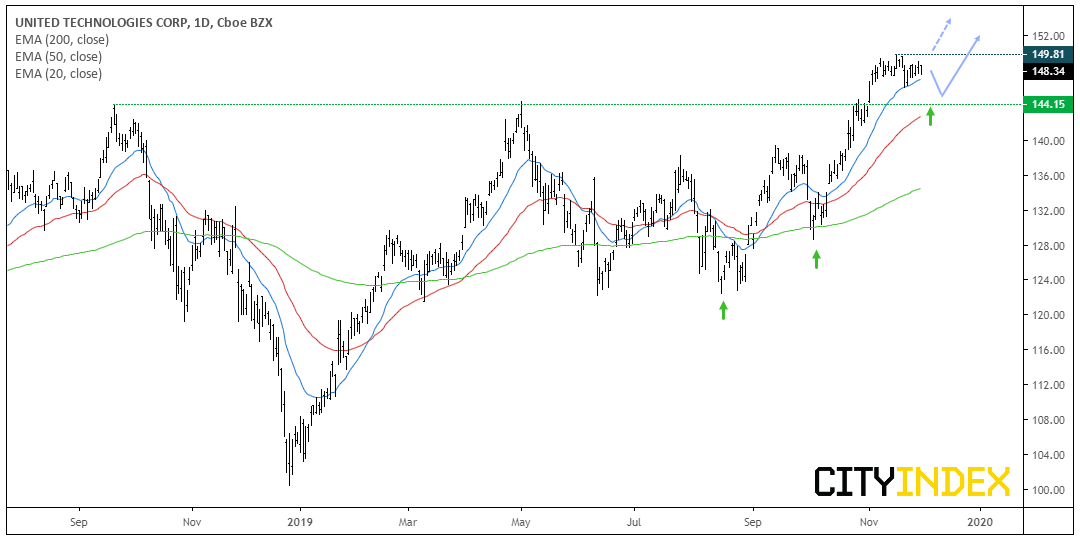
United Technologies CFD/DFT: Prices are consolidating just below record high, and the 20-day eMA is providing support. At the beginning of November we saw a break of key resistance around 144, and the bullish trend from the September low appears to be an impulsive wave. Due to strength of momentum leading into the current consolidation, we expect prices to eventually break higher.
-
Bias remains bullish above 144, which means bulls can see dips above this level in case momentum takes it lower initially.
-
If momentum takes it higher out of the current consolidation zone, bulls can use an open upside target as we’re back at record highs.

Apache Corp CFD/DFT: The SP500 Energy index is the worst performing sector over the last 12 months (and the only one to trade lower over this period). At -15.1% YTD, Apache is not the weakest is underperforming relative to the sector although no oversold to the point it could not go lower from here.
A series of lower highs below 38 shows bearish momentum is building and Friday’s bearish candle suggests prices could be headed lower.
-
Near-term bias remains bearish below 23.14.
-
Bears can wait for a break of 22.00 – 22.19 to confirm a resumption of the downtrend.
-
The lows around 20 make viable downside targets. A break beneath here would take prices to their lowest levels since 2001.

Nisource CFD/DFT: Momentum since the 2019 high has been predominantly bearish, with losses coming quite hard and fast. Support was recently found at the February low around 26, and prices have retraced higher although Friday’s bearish hammer suggests the corrective. That the bearish hammer stalled beneath the 26.38 resistance and 38.2% Fibonacci levels adds further weight to the corrective move nearing its completion.
-
Bias remains bearish below 27.
-
Bears can either look to ‘pick at the highs’ (fade into minor rallies) below 27 and assumes prices will revisit support around 26.
-
Alternatively, wait for a break below 26.38 support before assuming a return to the 26 area.
Price Action Update
J.P. Morgan Chase CFD/DFT: Trading just off record highs, there are signs of exhaustion with a series of doji’s, hammers and a pinbar. Still, the trend remains bullish 127.42 so bulls could look for potential dips above this key support level to consider longs.
Cabot Oil and Gas Corp CFD/DFT: T1 was reached around $16 and prices are consolidating near multi-year lows. The bias remains bearish below $17 and for prices to move towards the 14.67 double-top target, although $15 also makes a viable target.
Autozone CFD/DFT: Resistance around 1190 remains in place and Friday produced a bearish engulfing candle / dark cloud cover reversal at these highs. Ultimately it could either be in a wide, oscillating channel which could be confirmed with a break below 1150 but, if 1150 holds as support and it breaks higher, it can be assumed momentum has realigned with the longer-term bullish trend.
Verisk Analytics CFD/DFT: It blow past the resistance zone, so has been removed from the short watchlist.
Author

Matt Simpson, CFTe, MSTA
CityIndex
Matt Simpson is a certified technical analyst who combines charts and fundamentals to generate trading themes.


