S&P 500: The market is likely due for a pullback or decline

Recap 5/17 – Tuesday, the S&P gapped open up 44 handles and then rallied another 18 handles into a 9:30 AM high. From that high, the S&P declined 36 handles into a 10:46 AM low of the day. From that low, the S&P rallied 47 handles into a 2:08 PM high. From that high, the S&P declined 38 handles into a 2:23 PM low. From that low, the S&P rallied 48 handles into a 3:22 PM high of the day. From that high, the S&P dipped 15 handles into a 3:49 PM low. From that low, the S&P rallied 13 handles into the close.
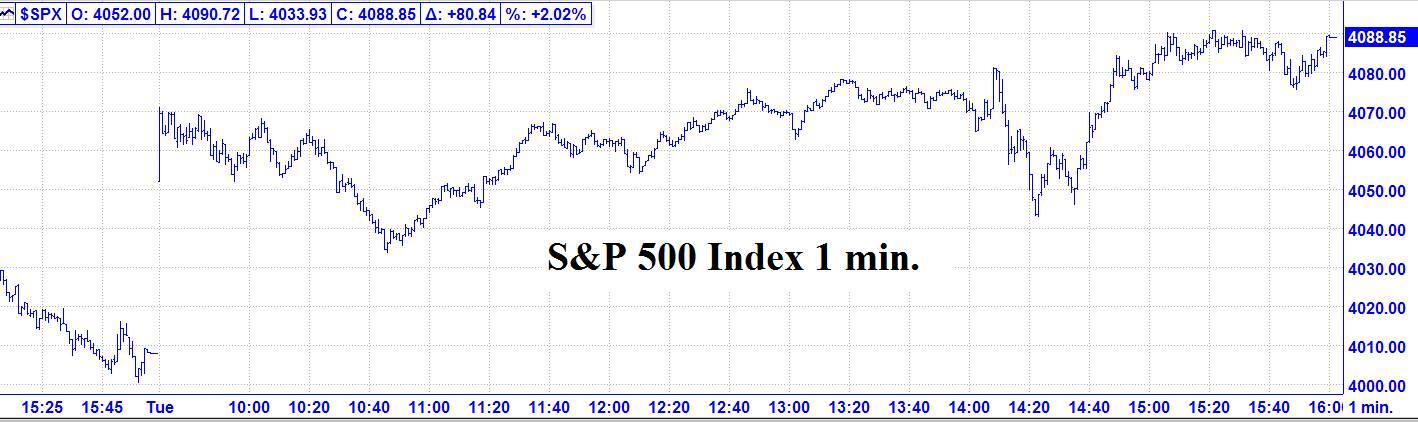
5/17 – The major indices, had a huge up day and finished per the following closes: DJIA + 431.17; S&P 500 + 80.84; and the Nasdaq Composite + 321.73.
Looking ahead – Given we allow one trading day for our change in trend points, last chance for a high from Mercury 0 South Latitude is Wednesday first half hour. In fact, that may have manifested itself on Monday’s low. However, given the muddled picture, I already recommend that you get out if the market did not turn down during Tuesday AM. On another front, please see my technical comments on the S&P 500 below.
For the next few days, the planets are taking a break. Our next change in trend point is a Market Math date of 5/19.
The Now Index is in the NEUTRAL ZONE.
Coming events
(Stocks potentially respond to all events).
3. A. 5/23 AM – Jupiter 90 US Venus. Major change in trend US Stocks, T-Bonds, US Dollar.
B. 5/24 AC – Geo Mars enters Aries. Important change in trend Corn, Gold, OJ, Silver, Sugar, Wheat.
C. 5/27 AC – Mercury Aphelion. Major change in trend Corn, Oats, Soybeans, Wheat.
D. 5/27 AC – Jupiter 45 US Moon. Moderate change in trend US Stocks, T-Bonds, US Dollar.
E. 5/27 AC – Jupiter Parallel Latitude Neptune. Major change in trend Commodity Index, Oats, Oil.
F. 5/27 AC – Helio Saturn Contra-Parallel Uranus. Major change in trend Cattle, Coffee, Copper, Cotton.
D. 5/27 AC – New Moon in Gemini. Major change in trend Financials, Grains, Precious Metals
Stock market key dates
5/19 = 29,241 (171^2) days > 4/28/1942 Major Low
5/28 (Sat.) = 8,100 (90^2) days > 3/24/2000 MAJOR TOP
Fibonacci – 5/28
Astro – 5/23, *5/27*
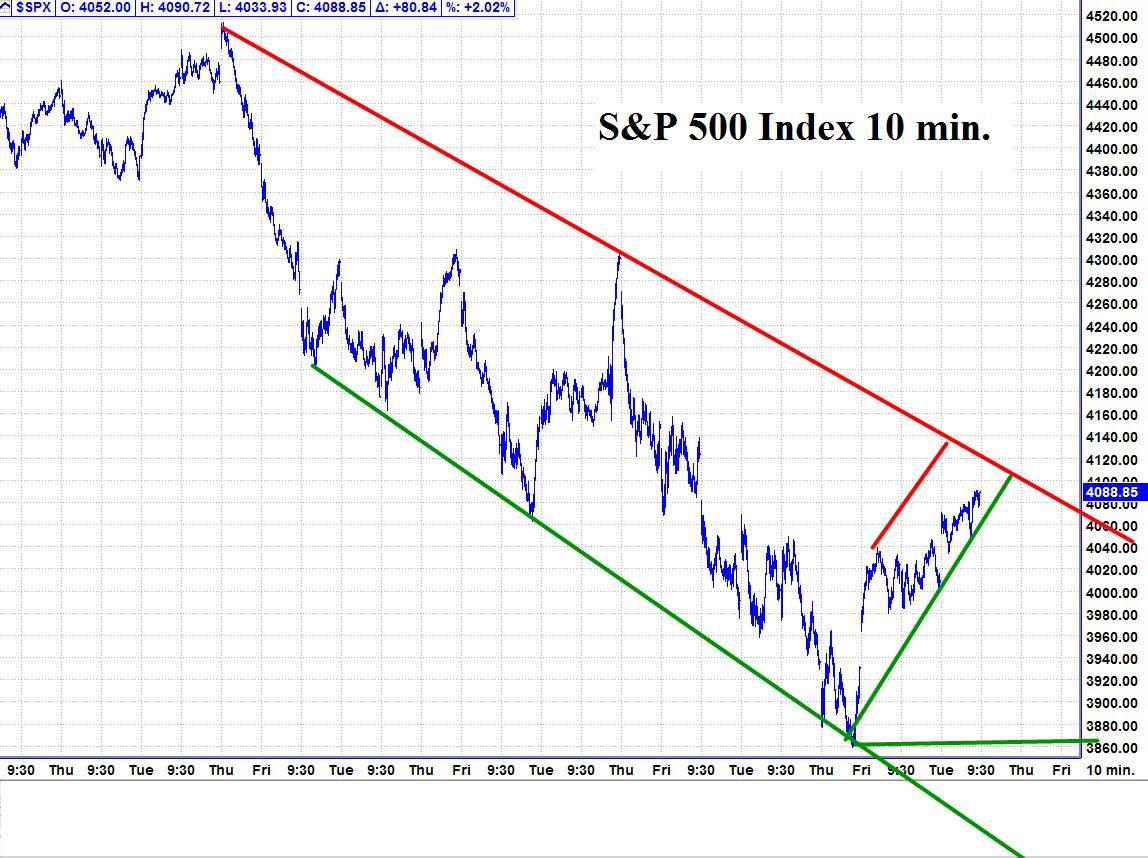
Please note that as of the 5/17 close, the S&P 500 Index was bumping up against the top of an important trend line and down channel. This means the market is likely due for a pullback or decline If the market can overcome the top of this channel, then there is a good chance for much higher prices.
Please see below the S&P 500 10 minute chart.
Support - 4060 Resistance – 4100
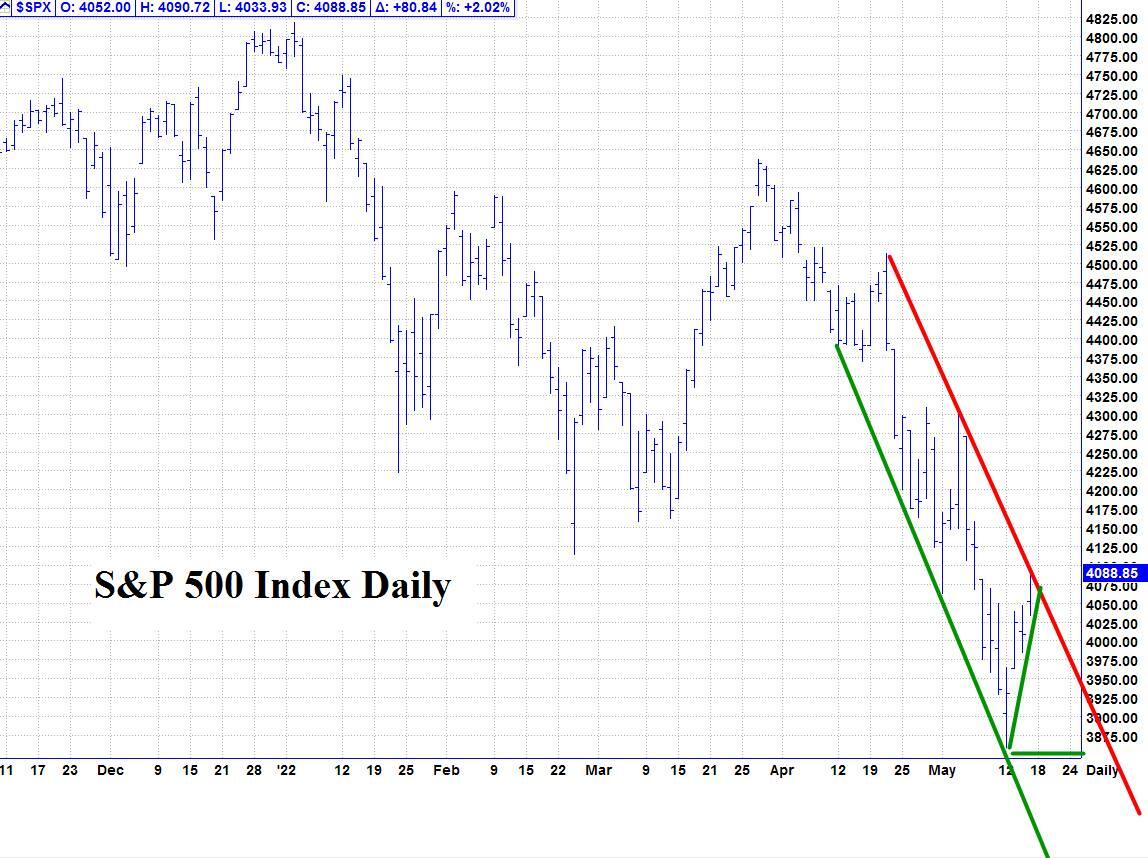
Please see below the S&P 500 Daily chart
Support - 4060 Resistance – 4100
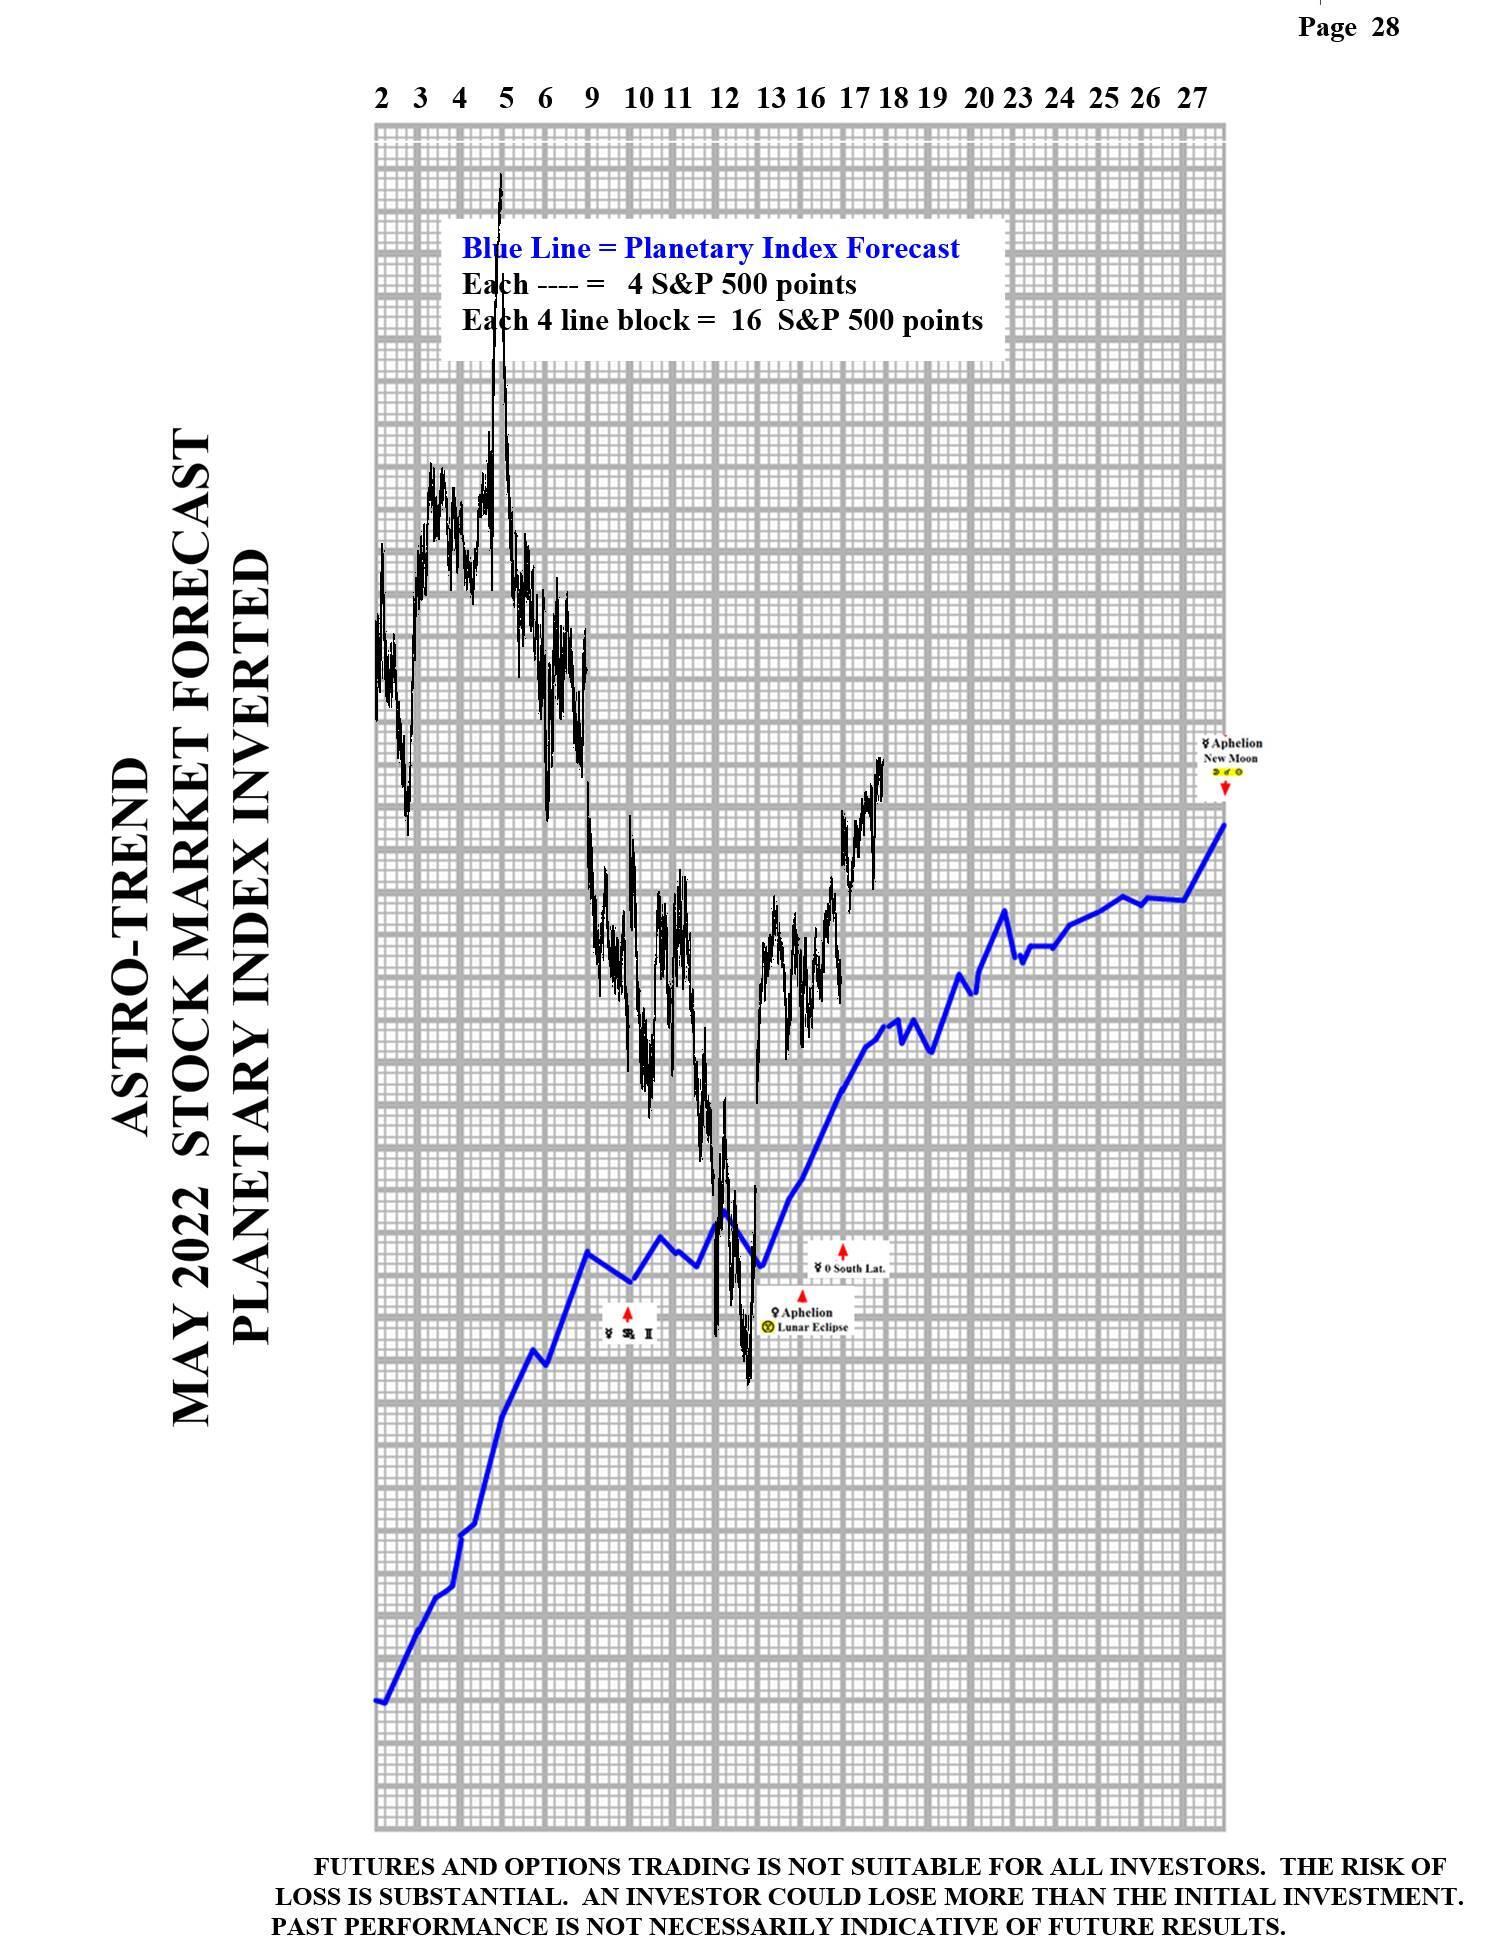
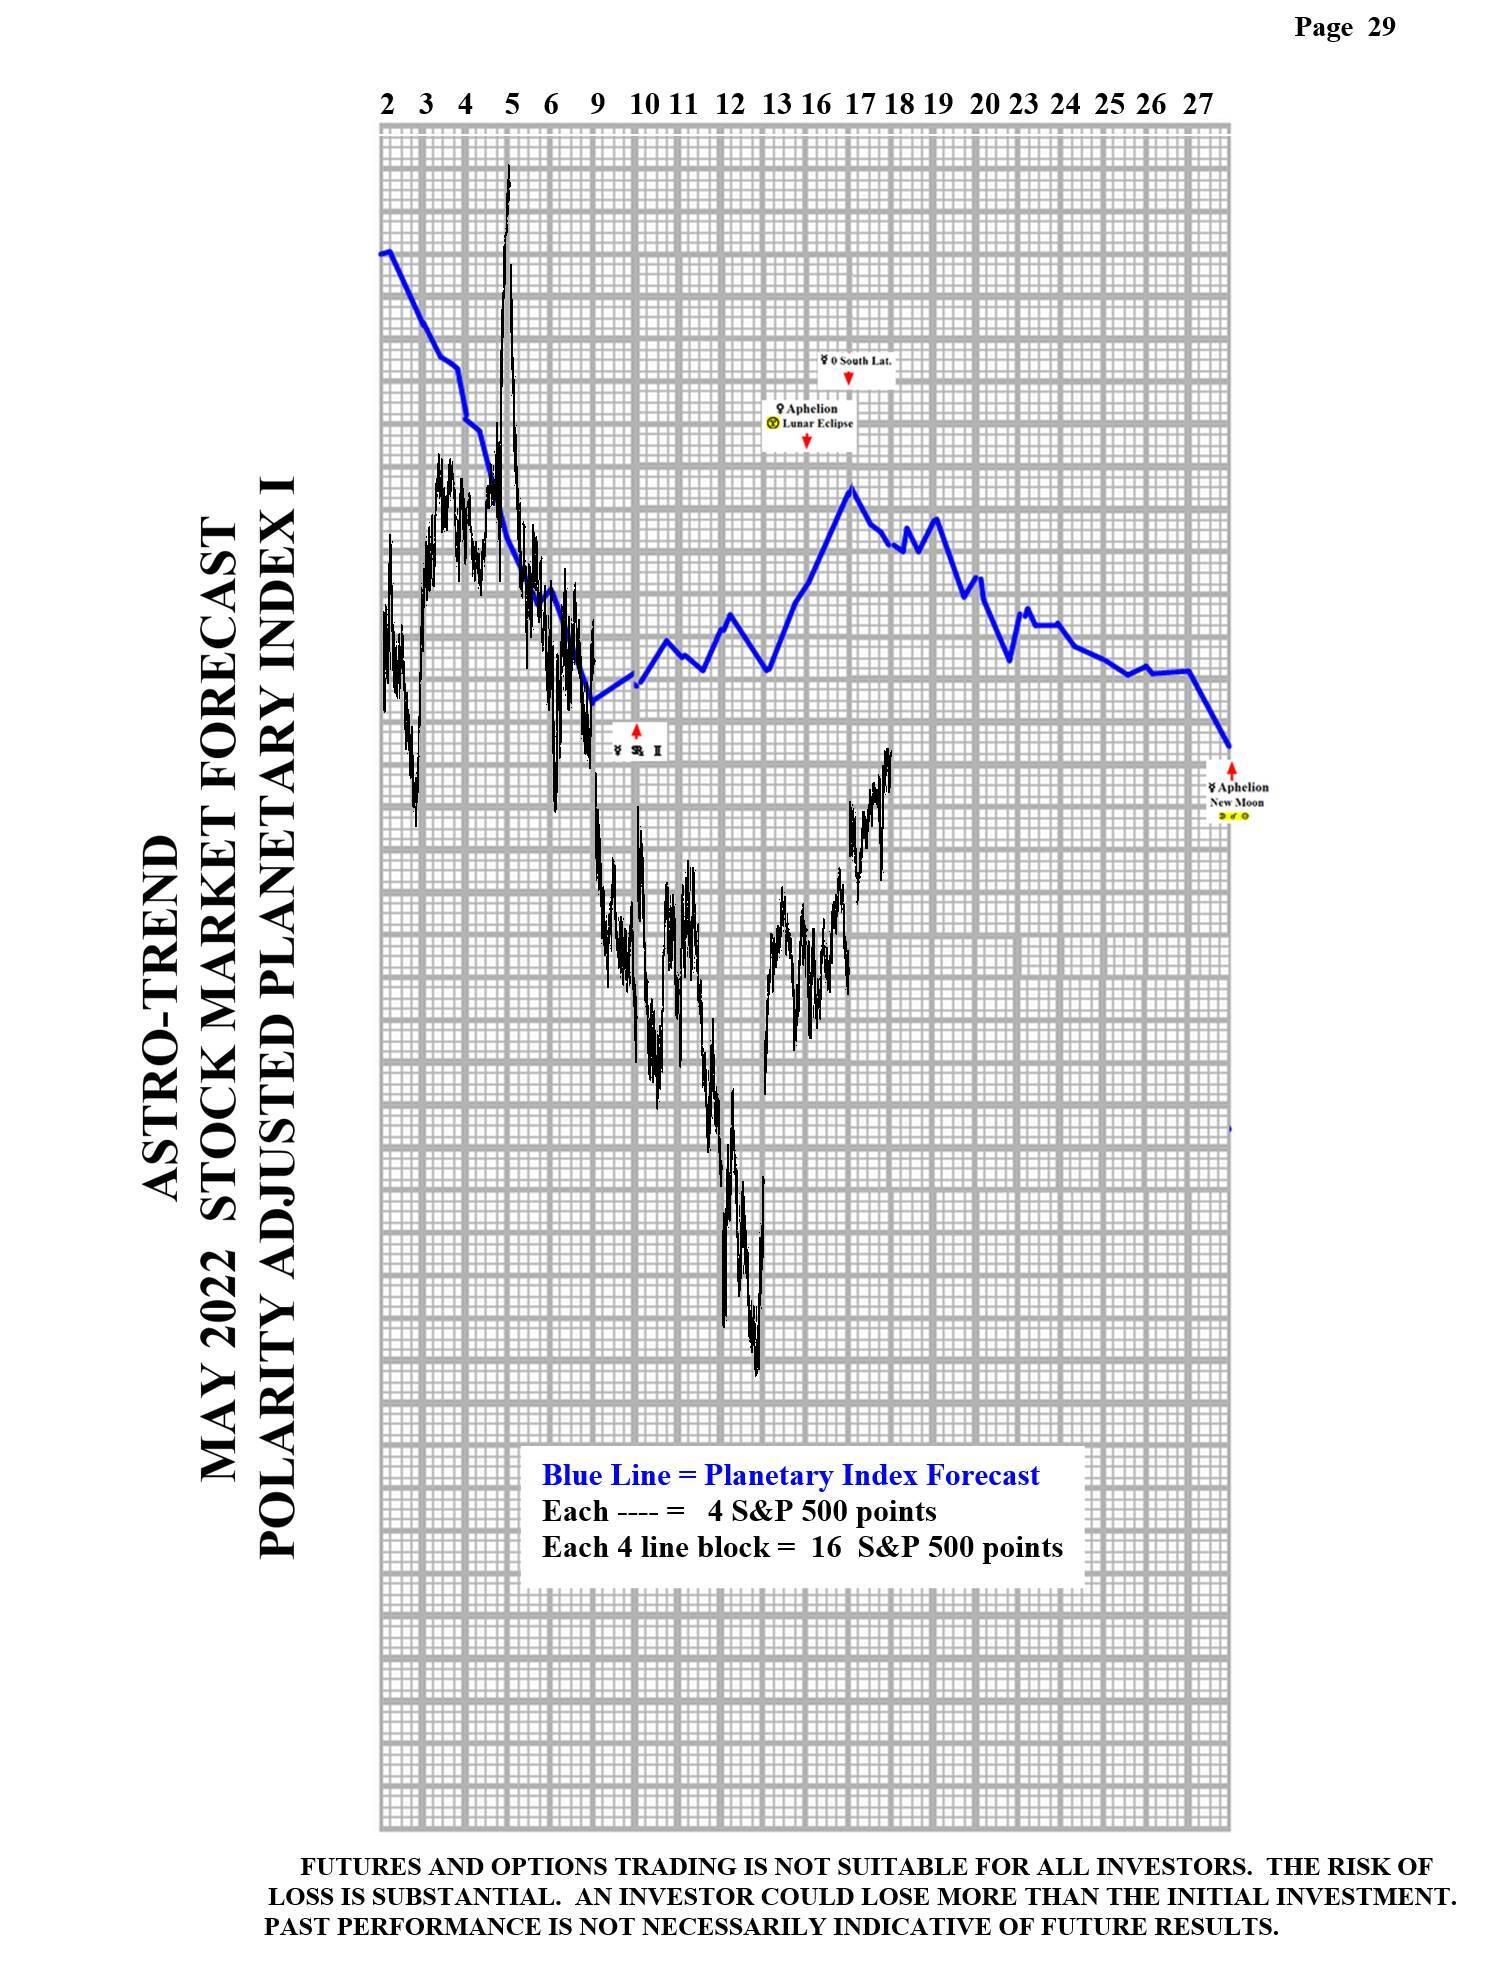
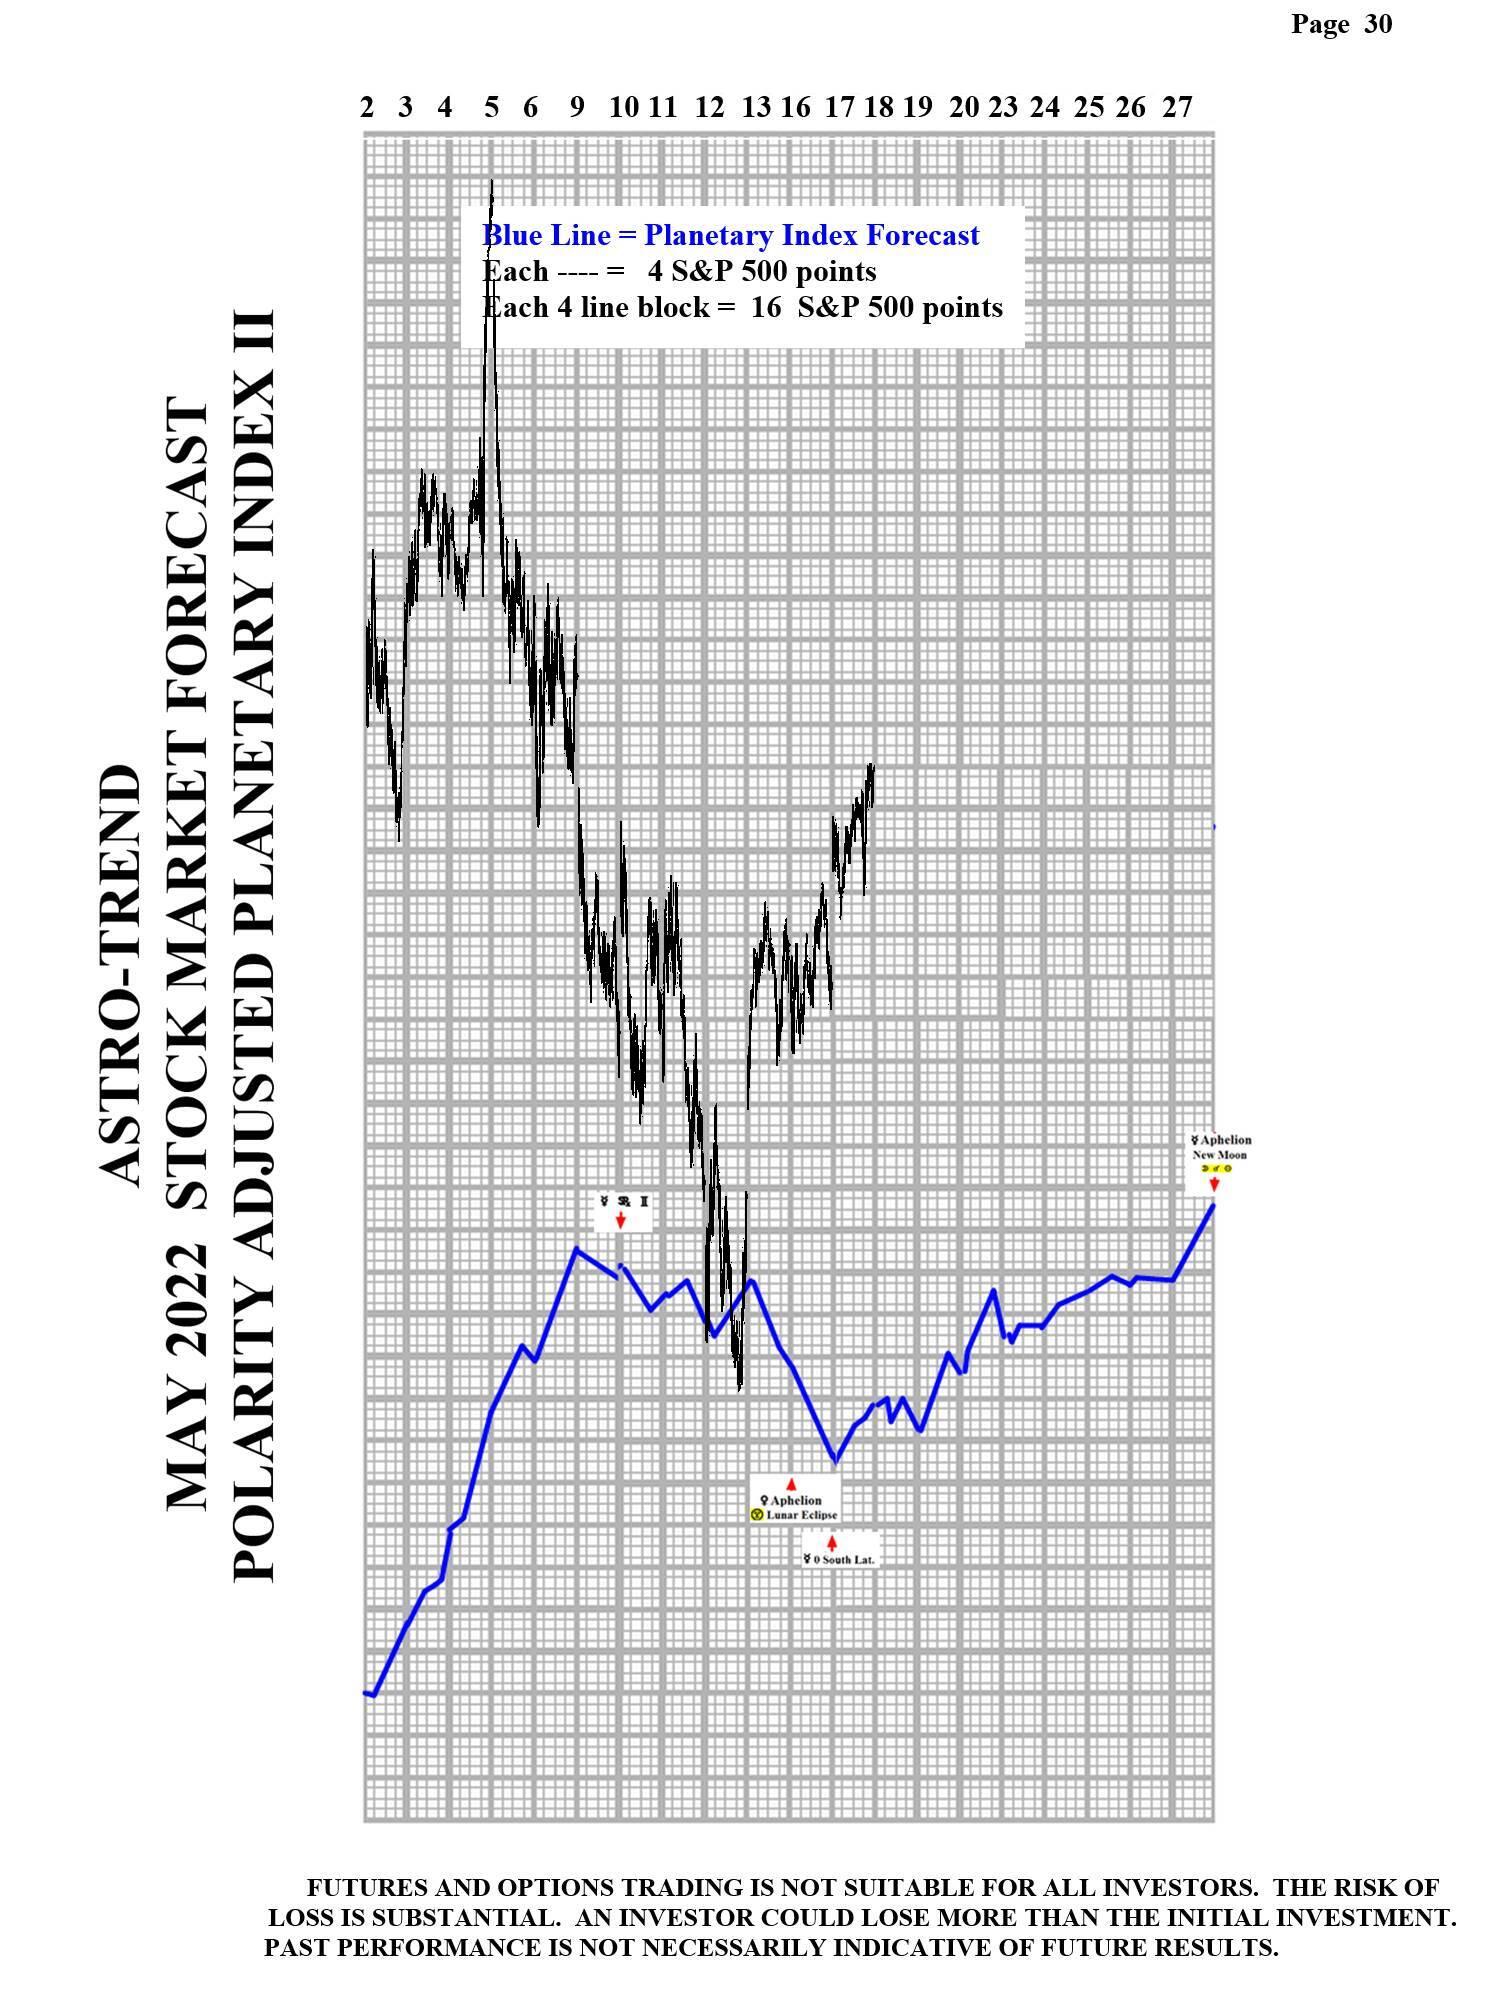
Please see below the April Planetary Index chart with S&P 500 10 minute bars for results.

Author

Norm Winski
Independent Analyst
www.astro-trend.com


