S&P 500 is poised to open much lower, is this a dip-buying opportunity?

Stocks are breaking down! The S&P 500 index fell almost 1% on Friday and today it is poised to open 1.8% lower. Are we getting close to a local low?
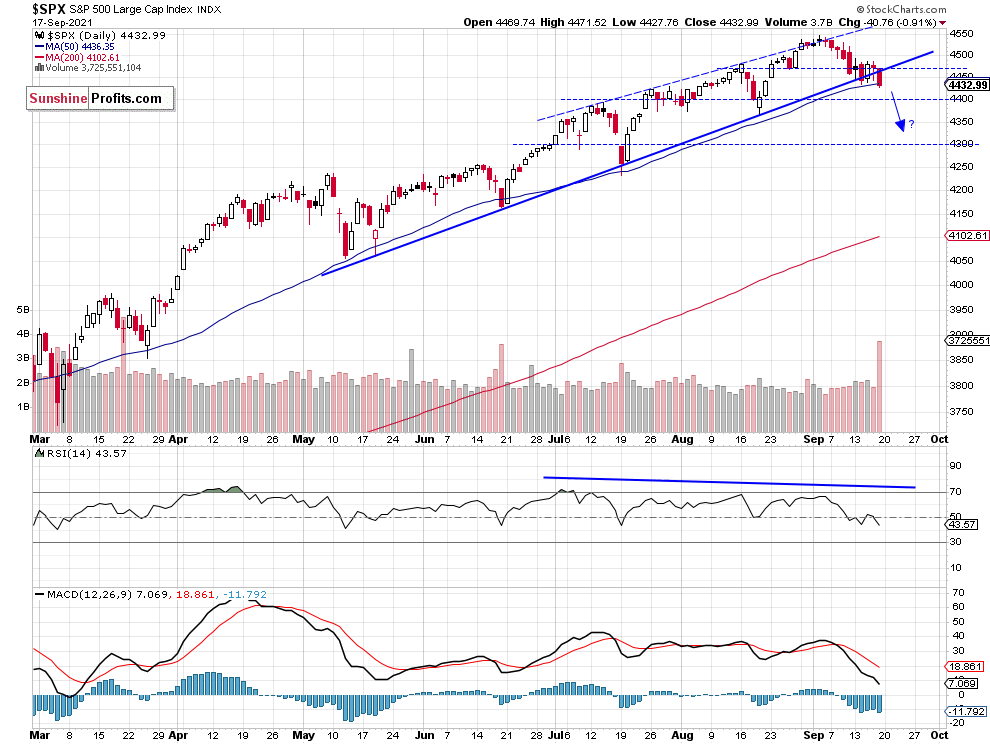
The broad stock market index broke below its short-term consolidation on Friday, as the S&P 500 index fell below its recent local lows along 4,450 price level. On September 2 the index reached a new record high of 4,545.85. Since then it has lost almost 120 points. This morning stocks are expected to open much lower following big declines in Asia and Europe after news about Evergrande Real Estate Group crisis in China.
The nearest important support level of the broad stock market index is now at 4,300-4,350 and the next support level is at 4,200. On the other hand, the nearest important resistance level is now at 4,400-4,450, marked by the previous support level. The S&P 500 broke below its over four-month-long upward trend line, as we can see on the daily chart.
Dow Jones is leading lower
Let’s take a look at the Dow Jones Industrial Average chart. The blue-chip index broke below a potential two-month-long rising wedge downward reversal pattern recently. It remained relatively weaker in August - September, as it didn’t reach a new record high like the S&P 500 and the Nasdaq. Today it may sell off to 34,000 level or lower. The next support level is at around 33,250-33,500 and the resistance level is at 34,500, marked by the recent support level, as we can see on the daily chart:

Apple breaks below upward trend line
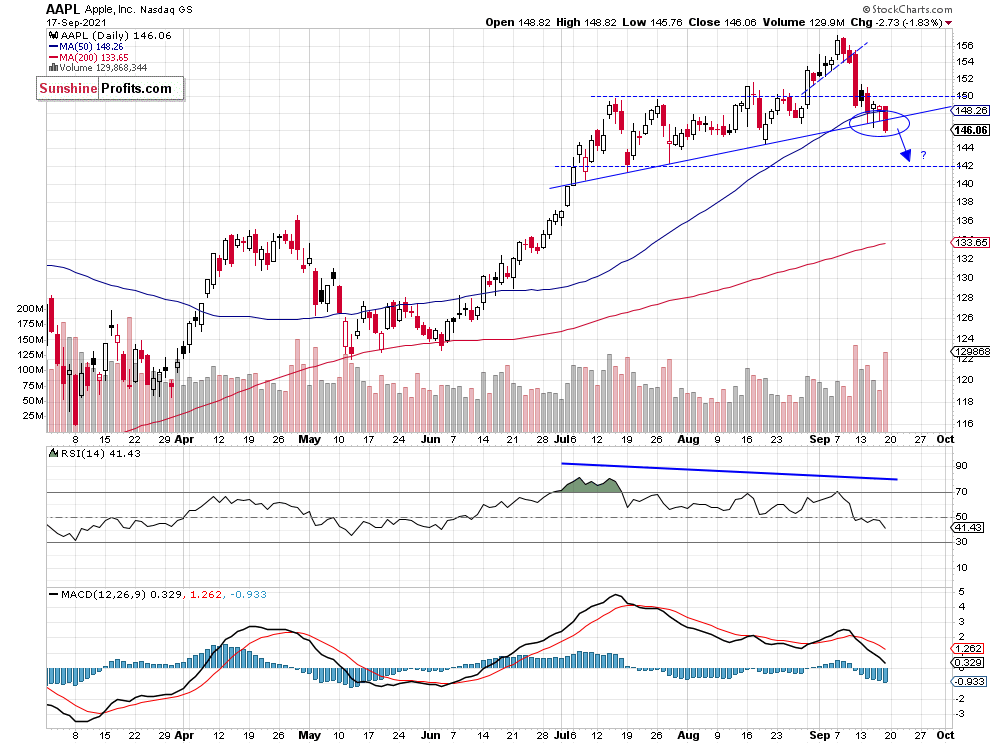
Apple stock weighs around 6.3% in the S&P 500 index, so it is important for the whole broad stock market picture. In early September it reached a new record high of $157.26. And since then it has been declining. So it looked like a bull trap trading action. We can still see negative technical divergences between the price and indicators and a potential topping pattern. The stock is breaking below an over two-month-long upward trend line.
September last year – S&P 500 fell almost 11%
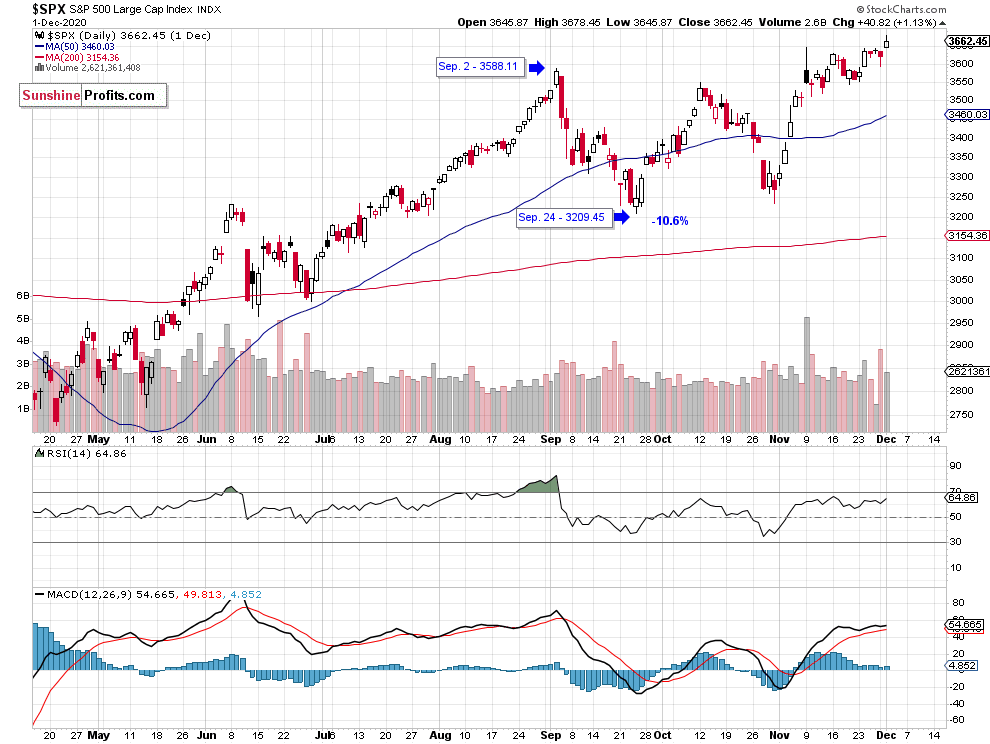
In 2020, the S&P 500 index reached a local high of 3,588.11 on September 2 and in just three weeks it fell 10.6% to local low of 3,209.45 on September 24. This year, September’s downward correction has started from the new record high of 4,545.85 on September 3, so there is a striking similarity between those two trading actions.
Conclusion
The S&P 500 index broke below its short-term consolidation on Friday and today it will most likely accelerate the downtrend from the early September record high. However, later in the day we may see some short-term/ intraday bottoming trading action.
The market seems overbought, and we may see some more profound downward correction soon. Therefore, we think that the short position is justified from the risk/reward perspective.
Here’s the breakdown:
-
The market is extending its downtrend today, as the S&P 500 index is likely to open much below 4,400 level.
-
Our speculative short position is still justified from the risk/reward perspective.
-
We are expecting a 5% or bigger correction from the record high.
Want free follow-ups to the above article and details not available to 99%+ investors? Sign up to our free newsletter today!
Want free follow-ups to the above article and details not available to 99%+ investors? Sign up to our free newsletter today!
Author

Paul Rejczak
Sunshine Profits
Paul Rejczak is a stock market strategist who has been known for the quality of his technical and fundamental analysis since the late nineties.


