Silver Price Forecast: Defending this key support is critical for XAG/USD bulls
- Silver price rebounds from 200-DMA but 50% Fib level caps the upside.
- Downside bias remains intact amid bearish RSI.
- 61.8% Fibo support holds the key for silver price.

Silver price (XAU/USD) witnessed the steepest drop in nearly five months on Thursday, extending its bearish momentum into the fifth straight session. The white metal hit a seven-week low at $25.77 after the hawkish surprise delivered by Fed Chair Jerome and Co, on Wednesday lifted the odds of monetary normalization sooner than previously thought. The Treasury yields surged on the Fed’s hawkishness and boosted the US dollar’s demand across the board. Higher rates dull the appeal of yieldless gold and silver. However, the upbeat US Jobless Claims eased fears over the world’s most powerful central bank’s hawkish move, which helped silver price recover some ground, although the bright metal finished the day below the $26 mark.
On the final trading day of the week, silver price has paused its downtrend, attempting a tepid bounce amid a pullback in the greenback. The bulls still remain cautious amid a steady recovery in the US rates. If the US dollar retreat extends, silver’s recovery momentum could gain traction. It’s worth noting that higher inflation along with a potential lift-off by the Fed usually points to a strengthening US economy, which implies improved prospects for industrial metals such as silver. However, any recovery is likely to remain short-lived in the near term.
Silver Price Chart - Technical outlook
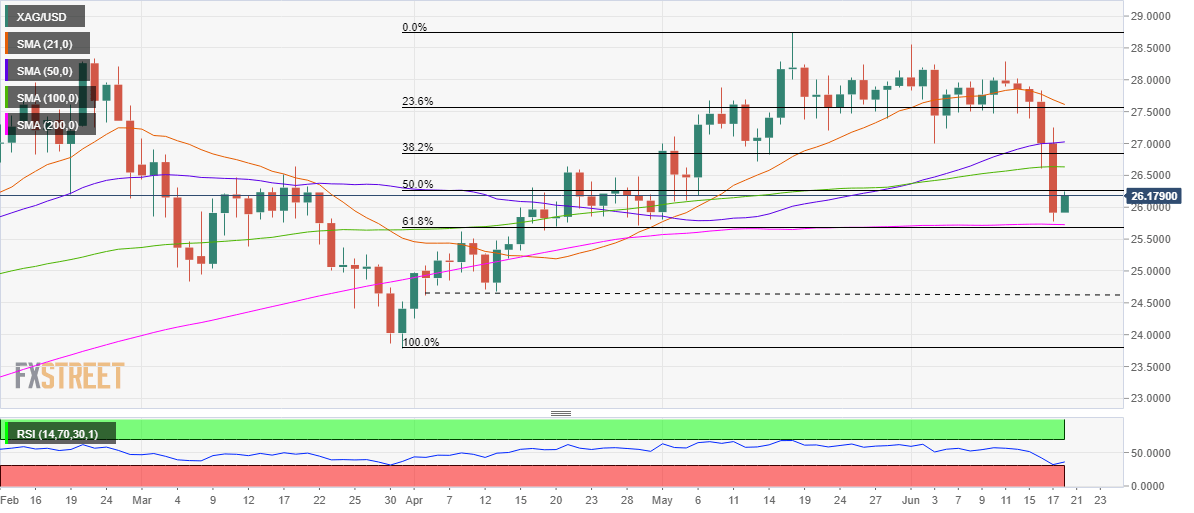
Silver: Daily chart
As observed on silver’s daily chart, the sell-off just stalled ahead of the critical support near $25.70, which is the confluence of the 200-Daily Moving Average (DMA) and the 61.8% Fibonacci Retracement of the rally from March lows of $23.78 to May highs of $28.75.
At the time of writing, the price is battling resistance at $26.25, which is the 50% Fibonacci levels of the same advance.
A sustained break above that level is needed to extend the corrective upside, above which the horizontal 100-DMA at $26.63 could be probed.
The next relevant barrier is seen at the $27 round number.
The Relative Strength Index (RSI) has rebounded from the lower levels but remains below 50.00, suggesting that the bearish bias still holds intact.
Alternatively, if the abovementioned critical support around $25.75 is taken out convincingly, a drop towards the horizontal (dashed) trendline support at $24.65 will be likely on the cards.
Premium
You have reached your limit of 3 free articles for this month.
Start your subscription and get access to all our original articles.
Author

Dhwani Mehta
FXStreet
Residing in Mumbai (India), Dhwani is a Senior Analyst and Manager of the Asian session at FXStreet. She has over 10 years of experience in analyzing and covering the global financial markets, with specialization in Forex and commodities markets.


