![]() Richard Perry
Richard Perry
Independent Analyst
Market Overview
Another drip feed of positive newsflow from the push towards a Phase One trade agreement between the US and China has boosted market sentiment again. The discussion is turning to the potential for tariff removal, which would be a real boost for sentiment if agreed. The impact is coming through higher Treasury yields but also the continued steepening of the US yield curve (US 3 month/10 year spread is now at over +25bps and at eight month highs). This has helped the shift out of risk averse assets such as the Japanese yen, Swiss franc and gold. Subsequently we see flow into higher beta currencies, such as the Aussie, Canadian dollar, but also the US dollar. Another key indicator of this risk improvement is the Chinese yuan which is strengthening back towards 7.00 against USD, a level not seen since mid-August. The positive risk environment has also continued to see flow into equities, where we now have seen the Dow Jones Industrial Average moving into all-time highs. Will this positivity last though? The ISM Non-Manufacturing reading will give a crucial insight as to whether the continued manufacturing sector contraction is pulling into the all-important consumer sector. The Reserve Bank of Australia held monetary policy unchanged today with rates at +0.75% (no change expected at +0.75%). The RBA will continue to monitor the outlook for consumer spending and inflation. There is an ongoing expectation of a rate cut in the coming months, but as yet the RBA is holding firm.

Wall Street closed another positive session with markets at all-time highs. The S&P 500 closed another +0.4% higher at 3078, whilst US futures are another +0.2% higher in early moves today. This has helped Asian markets higher with the Nikkei +1.8% higher (although playing catch up after a public holiday yesterday) along with the Shanghai Composite +0.5%. In Europe, there is a following of US futures, with FTSE futures +0.2% and the DAX futures +0.2% higher. In forex, the positive risk environment is showing through with underperformance of the safe havens JPY and CHF, whilst the commodity currencies are all stronger with AUD and NZD leading the way. In commodities, gold is marginally weaker whilst silver is supported. Oil is trading mixed after its recent gains.
The services PMIs will be key for today’s economic calendar. The UK Services PMI is at 0930GMT and is expected to improve marginally to 49.7 (from 49.5 in September). The US Trade Balance is at 1330GMT with an expectation that the deficit would improve marginally in September to -$52.5bn (from August’s -$54.9bn). The US ISM Non-Manufacturing is at 1500GMT and is expected to improve to 53.5 in October (from 52.6 in September).
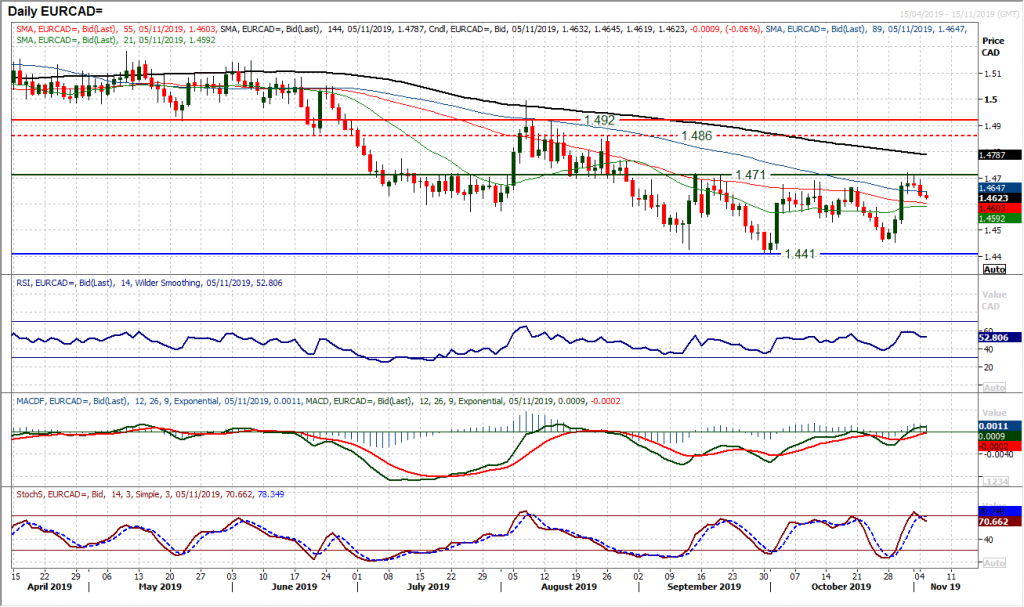
Chart of the Day – EUR/CAD
The euro outlook may have been improving recently, however throughout 2019, the Canadian dollar has been driving continued outperformance. This means that EUR/CAD has been posting consistent lower highs and lower lows. A sharp rebound last week certainly posed a few questions of this outlook, but for now at least, the key multi-month pivot band around 1.4700/1.4720 remain intact as resistance. It was interesting to see the rally losing momentum at the resistance to now turn lower. The RSI falling over again around 60, as it has done throughout 2019 gives a sense of another chance to sell. MACD lines are struggling for traction around neutral whilst Stochastics also bear crossing around 80. A decisive negative candle yesterday seems to have pulled the sellers back in, with a close under 1.4640 (initial support). The hourly chart shows negative pressure beginning to take hold whilst below 1.4640 completes a small top and would imply -80 pips initially. This would then re-open the key lows around 1.4410/1.4450. Initial support at 1.4550/1.4580. The importance of resistance at 1.4710 is just growing.
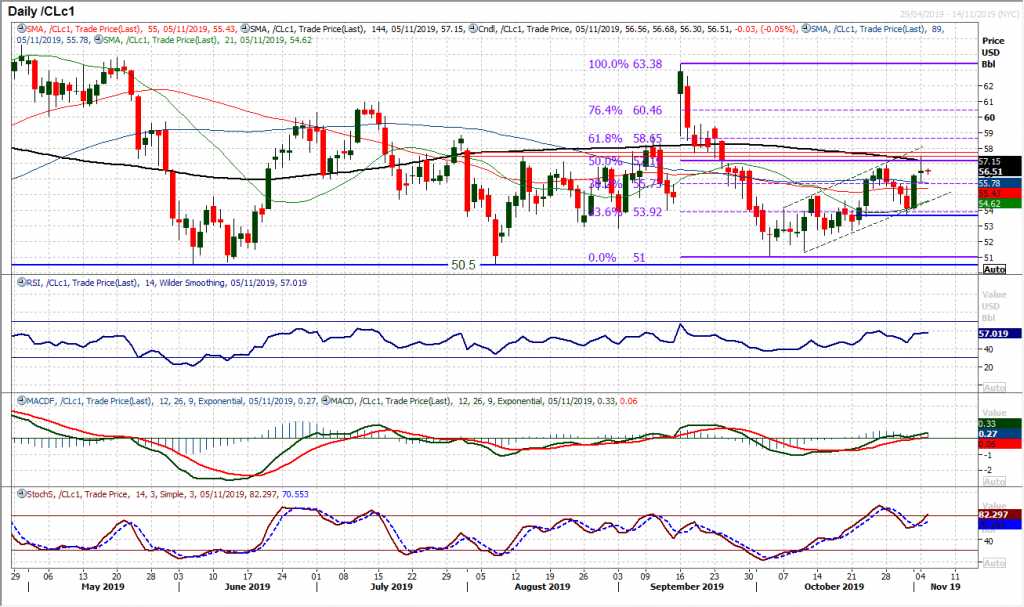
WTI Oil
A couple of positive sessions looked to be flipping the outlook of gold positive again, but traction is questionable. Given the run of higher lows, an uptrend channel is still a viable argument, but the recovery continues to splutter. There is a bullish bias with the momentum indicators, with the MACD lines above neutral and Stochastics turning higher again above 50. However, a breakout above $56.90 faltered into the close to form a rather questionable positive candle yesterday. The 50% Fibonacci retracement (of $63.40/$51.00) at $57.20 is also an overhead barrier. The bull trend channel of the past few weeks is certainly still in play and this means that buying into weakness is still a viable strategy. The only concern is that decisive traction in the recovery is repeatedly lost. Initial support now $55.60/$55.90.
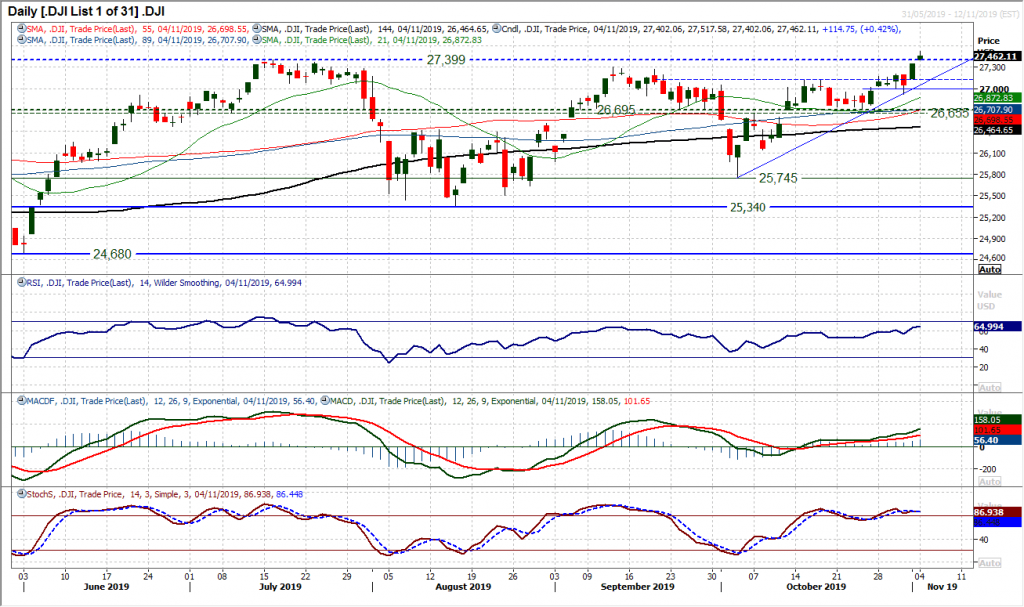
Dow Jones Industrial Average
Finally the Dow has joined the S&P 500 in all-time high territory. The impressively strong candle from Friday has been followed by a gap and close into all-time high above the old July peak of 27,399. Momentum is strong and is confirming the move, with RSI rising in the mid-60s to four month highs, but also having further upside potential. The immediate thought needs to be the gap which remains open at 27,347 meaning there is support 27,347/27,399 now. However, the configuration is strong to the extent that weakness will be seen as an opportunity for the bulls. Futures are suggesting additional gains at the open today. Yesterday’s high of 27,517 is initial resistance, but the shackles are now off and the bulls can set their sights higher now.
Note: All information on this page is subject to change. The use of this website constitutes acceptance of our user agreement. Please read our privacy policy and legal disclaimer. Opinions expressed at FXstreet.com are those of the individual authors and do not necessarily represent the opinion of FXstreet.com or its management. Risk Disclosure: Trading foreign exchange on margin carries a high level of risk, and may not be suitable for all investors. The high degree of leverage can work against you as well as for you. Before deciding to invest in foreign exchange you should carefully consider your investment objectives, level of experience, and risk appetite. The possibility exists that you could sustain a loss of some or all of your initial investment and therefore you should not invest money that you cannot afford to lose. You should be aware of all the risks associated with foreign exchange trading, and seek advice from an independent financial advisor if you have any doubts.
Recommended Content
Editors’ Picks
EUR/USD holds below 1.0750 ahead of key US data

EUR/USD trades in a tight range below 1.0750 in the European session on Friday. The US Dollar struggles to gather strength ahead of key PCE Price Index data, the Fed's preferred gauge of inflation, and helps the pair hold its ground.
USD/JPY stays firm above 156.00 after BoJ Governor Ueda's comments

USD/JPY stays firm above 156.00 after surging above this level on the Bank of Japan's decision to leave the policy settings unchanged. BoJ Governor said weak Yen was not impacting prices but added that they will watch FX developments closely.
Gold price oscillates in a range as the focus remains glued to the US PCE Price Index

Gold price struggles to attract any meaningful buyers amid the emergence of fresh USD buying. Bets that the Fed will keep rates higher for longer amid sticky inflation help revive the USD demand.
Bitcoin Weekly Forecast: BTC’s next breakout could propel it to $80,000 Premium

Bitcoin’s recent price consolidation could be nearing its end as technical indicators and on-chain metrics suggest a potential upward breakout. However, this move would not be straightforward and could punish impatient investors.
US core PCE inflation set to signal firm price pressures as markets delay Federal Reserve rate cut bets

The core PCE Price Index, which excludes volatile food and energy prices, is seen as the more influential measure of inflation in terms of Fed positioning. The index is forecast to rise 0.3% on a monthly basis in March, matching February’s increase.