OPEC preview: Will oil prices rise above $60/barrel?

Oil prices traded on the front foot in Asia on expectations the major oil producers will extend the output cut deal.
The question is whether the major producers will extend the deal by 6-months, 9-months or 12-months. The OPEC monitoring committee has proposed nine-month cut extension. As discussed in a report yesterday, a 9-month extension may have been priced-in by the markets. A probability of a 12-month extension is low, although that could push oil prices above $60/barrel.
OPEC needs to change the perception
Whatever OPEC does, it should be enough to change the erroneous perception in the market that the drop in the OPEC and non-OPEC supply (due to an output cut deal) will be fully compensated by US oil producers. Only then, the oil prices could see a sustained break above $60 levels.
A sustained move above $60 could revive reflation trade at a time when the markets are losing confidence in Trump Presidency and China PPI appears to have topped out. A revival of reflation theme would also make it easy for the Fed to hike rates at a faster pace and also begin the process of balance sheet normalization.
Oil Technicals
Brent Key levels to watch out for
|
Brent Oil |
Monthly |
Weekly |
Daily |
|
R1 |
$58.35 (Jan high) |
$56.62 (Apr high) |
$55.08 (Feb 17 low) |
|
R2 |
$63.92 (Sep 2009 low) |
$58.35 (Jan high) |
$56.62 (Apr high) |
|
R3 |
$66.53 (200-MA) |
$62.97 (Feb 2015 high) |
$57.41 (Feb 2 high) |
|
S1 |
$52.83 (June 2016 high) |
$52.75 (10-MA) |
$53.82 (100-DMA) |
|
S2 |
$51.38 (Feb 2015 low) |
$52.04 (5-MA) |
$52.47 (50-DMA) |
|
S3 |
$46.62 (monthly low) |
$51.22 (50-MA) |
$52.04 (200-DMA) |
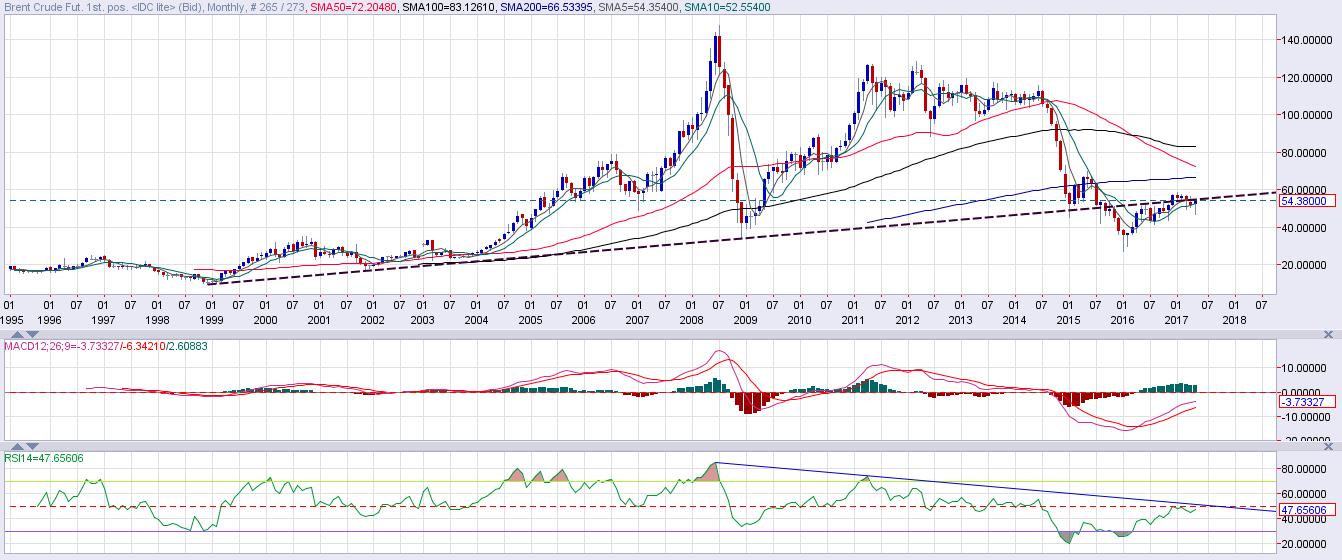
- A sharp recovery from the low of $46.62 if followed by a break above the resistance offered by rising trend line (drawn from 1998 low and 2008 low) would open doors for a re-test of $58.35 (Jan high) and $60.00 levels.
- A close above $60.00 would also help the RSI breach the falling trend line. That would mark a long-term trend reversal and would open up upside towards $66.53 (monthly 200-MA).
- On the downside, a break below $50.00 would revive the bearish view.
WTI Key levels to watch out for
|
WTI Oil |
Monthly |
Weekly |
Daily |
|
R1 |
$55.22 (Jan 2017 high) |
$53.76 (Apr high) |
$52.20 (May 24 high) |
|
R2 |
$57.04 (Oct 2006 low) |
$55.22 (Jan 2017 high) |
$52.75 (Feb 15 low) |
|
R3 |
$63.59 (200-MA) |
$62.58 (May 2015 high) |
$54.36 (Dec 2016 high) |
|
S1 |
$50.15 (10-MA) |
$49.07 (50-MA) |
$51.14 (100-DMA) |
|
S2 |
$47.05 (Mar 2017 low) |
$45.52 (100-MA) |
$50.72 (Jan 10 low) |
|
S3 |
$42.06 (Mar 2015 low) |
$43.78 (May 2017 low) |
$49.70 (200-DMA) |
WTI Oil monthly chart
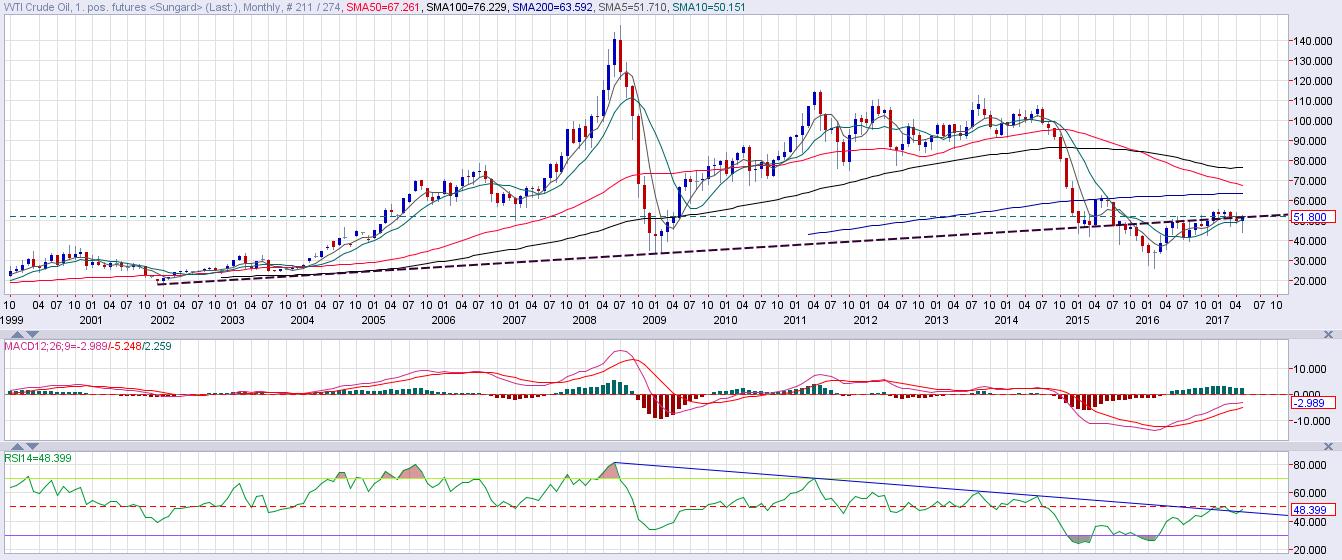
The price action is similar to the one seen on the Brent chart. An additional positive here is that the RSI has already breached the falling trend line.
Author

Omkar Godbole
FXStreet Contributor
Omkar Godbole, editor and analyst, joined FXStreet after four years as a research analyst at several Indian brokerage companies.


