Will OPEC boost oil prices and revive reflation trade?

The Organization of the Petroleum Exporting Countries meets in Vienna on Thursday to consider whether to prolong the deal reached in December in which OPEC and 11 non-members, including Russia, agreed to cut output by about 1.8 million barrels per day in the first half of 2017.
OPEC schedule
|
OPEC Meeting Opens |
10 a.m. in Vienna (0600 GMT, 2 a.m. ET) |
|
OPEC, non-OPEC Meeting Opens |
3 p.m. (1300 GMT, 9 a.m. ET) |
|
Press Conference with Barkindo and Novak |
5 p.m. (1500 GMT, 11 a.m. ET) |
Oil price performance
|
Oil benchmarks |
From Dec 10, 2016 to May 24 (Asian session) |
In the last one year |
|
Brent Oil |
-1.77% |
9.65% |
|
WTI Oil |
-1.55% |
5.61% |
Perception - OPEC subsidizes Shale
The first global oil output cut deal since 2001 reached in December 2016 failed to push oil prices above $60 levels. In fact, spikes to near $60 were short lived and prices actually fell to $45 levels. Experts have put the blame on the rising US shale output.
The Energy Information Administration (EIA) estimates that US crude oil production will lift 4.9% to 9.31 mbpd (million barrels per day) in 2017 and a further 7 % next year. The US rig counts have increased just over 50% since the December OPEC/non-OPEC deal.
However, the Shale producers are unlikely to replace all the proposed 1.8m/d cut to global oil supply. Nevertheless, oil prices struggled to even hold near $60 largely because there is a widespread belief on the trading floors that - a barrel of output cut by the OPEC ends up subsidizing a Shale barrel. What it effectively means that OPEC’s cut would be entirely replaced by the Shale supply.
Whatever OPEC will do tomorrow, it should be enough to change this erroneous perception. Only then the oil prices would see a sustained break above $60 levels.
Oil bearish news
Demand forecasts held unchanged: The OPEC kept its demand forecast unchanged at 1.27 mbpd. The OPEC now sees Non-OPEC supply growth of 0.95 mbpd in 2017 vs. previous forecast of 0.58 mbpd. The IEA forecast global demand growth of 1.3 mbpd in 2017, unchanged from its April report.
US plans to sell 50% of its oil reserves: President Donald Trump's proposal to sell half of the US strategic oil reserve pours cold water over the OPEC and non-OPEC’s effort to lift prices. As per Reuters report, “a release of half the oil reserve over 10 years equals about 95,000 barrels per day”. The White House proposal would also open areas of Alaska's Arctic region to exploration, potentially helping the United States further boost production.
Rouhani win seen speeding Iranian output growth: Iranian President Hassan Rouhani is in a stronger position to attract about $100bn to develop more than 50 oil and natural gas fields.
OPEC Scenarios
It is a no brainer that the entire oil sector risks downgrade and the Canadian dollar risks sell-off of epic proportions if the OPEC shocks market by not extending the output cut deal. Moreover, the likelihood of such a shocking outcome is very low.
The market pretty much expects the OPEC to extend the output cut deal by 9 months. The question here is whether it will extend the deal by 6 months or 9 months or 12 months.
Scenario I - Oil producers extend the output cut deal by 6 months
This won’t be enough to change the erroneous perception discussed above and could lead to sharp losses in oil benchmarks, Canadian dollar and oil and commodity shares across the globe.
Scenario II - Oil producers extend the output cut deal by 9 months
A minor boost in oil prices followed by profit taking looks more likely. The Canadian dollar could follow suit.
Scenario III - Oil producers extend the output cut deal by 12 months
This will be a positive shock and could yield a sustained break above $60 levels. The Canadian dollar could enjoy big rally along with oil and commodity shares across the globe. Moreover, a break above $60 levels would at least in part revive the reflation trade.
Brent Oil Daily chart
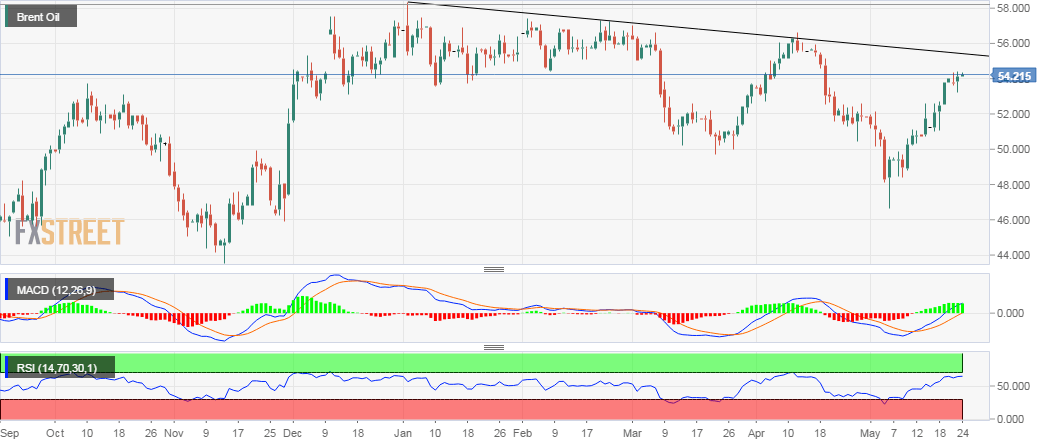
- A break above the falling trend line would open doors for $60 levels. Oil could jump above $60 levels in Scenario III and extend the rally to $64.00 levels. On the higher side, a major hurdle is seen directly at $72 (downward sloping monthly 50-MA).
- On the downside, $49.75 (March low) is strong support, which if breached would open up downside towards $45.22.
Oil rally above $60 could revive reflation trade
-636311962562272439.png)
- The above chart clearly shows the tight correlation between oil prices and the US inflation expectations (10-year breakeven inflation rate).
- Oil bottomed out in Jan/Feb last year as did the inflation expectations. China PPI bottomed out in July/Aug 2016 and boosted inflation expectations further. Trump victory was icing on the cake.
- As of now, china PPI is showing signs of exhaustion. Trump trade is long gone. No wonder, the inflation expectations are at the lowest level since October.
- Only a sustained break in the oil prices above $60 levels would revive the ‘reflation trade’. Revival of the reflation trade would also make it easy for the Fed to execute faster rate hikes and begin the process of balance sheet normalization.
CAD needs oil above $60
The CAD is already on the back foot as Bank of Canada is not seen raising rates until mid-2018. This makes the Canadian dollar and CAD denominated assets unattractive. If the OPEC fails to boost oil prices above $60, CAD could suffer sharp losses.
USD/CAD Monthly chart
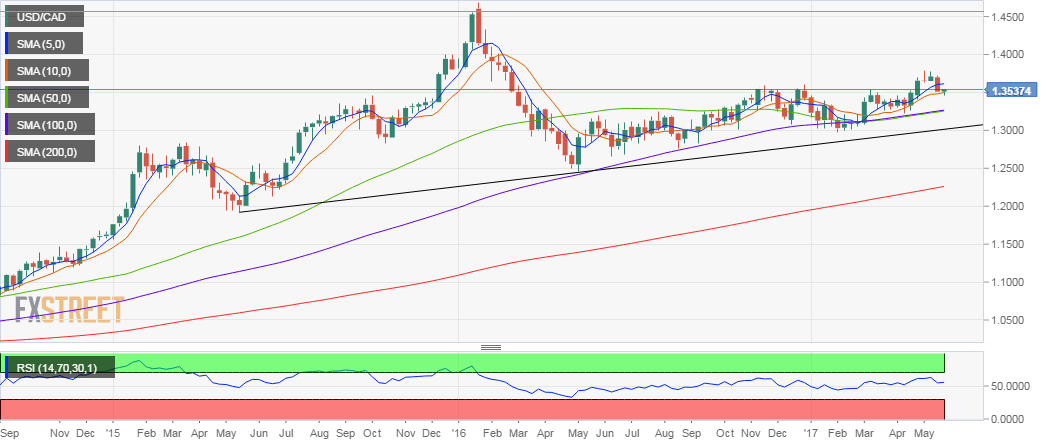
- All major averages - 50-MA, 100-MA, 200-MA are perfectly positioned one below the other. The 5-MA and 10-MA are sloping upwards as well.
- The RSI is nicely positioned above 50.00.
- The chart suggests the recovery from the monthly low of 1.3456 could be extended further towards 1.3610 and possibly to 1.38 levels if the OPEC fails to deliver a 9 month extension of the output cut deal.
- On the downside, strong support at 1.3262 (100-MA) and 1.3251 (50-MA) could be put to test if the major producers agree to extend the output cut deal for 12 months. The dip to 1.3262-1.3251 could be short lived as the Fed looks set to hike rates by 25 basis points in June.
Author

Omkar Godbole
FXStreet Contributor
Omkar Godbole, editor and analyst, joined FXStreet after four years as a research analyst at several Indian brokerage companies.


